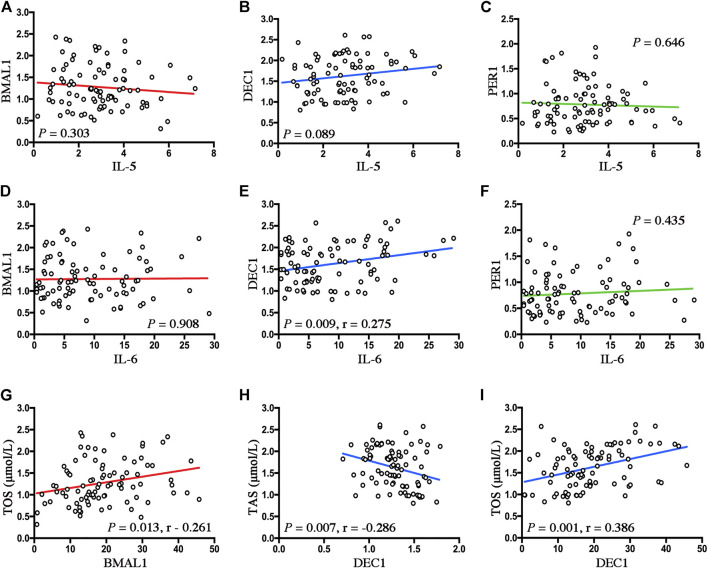
FIGURE 6.
Disrupted clock genes reflect the inflammatory and oxidant status in OSA. (A–C) Linear regression between expression levels of Baml1 (A), Dec1 (B), Per1 (C), and IL-5. (D–F) Linear regression among expression levels of Baml1 (D), Dec1 (E), Per1 (F), and IL-6. (G–I) Linear regression between expression levels of Baml1 and TOS (G); Dec1 and TSA (H); Dec1 and TOS (I).

