
Figure 1.
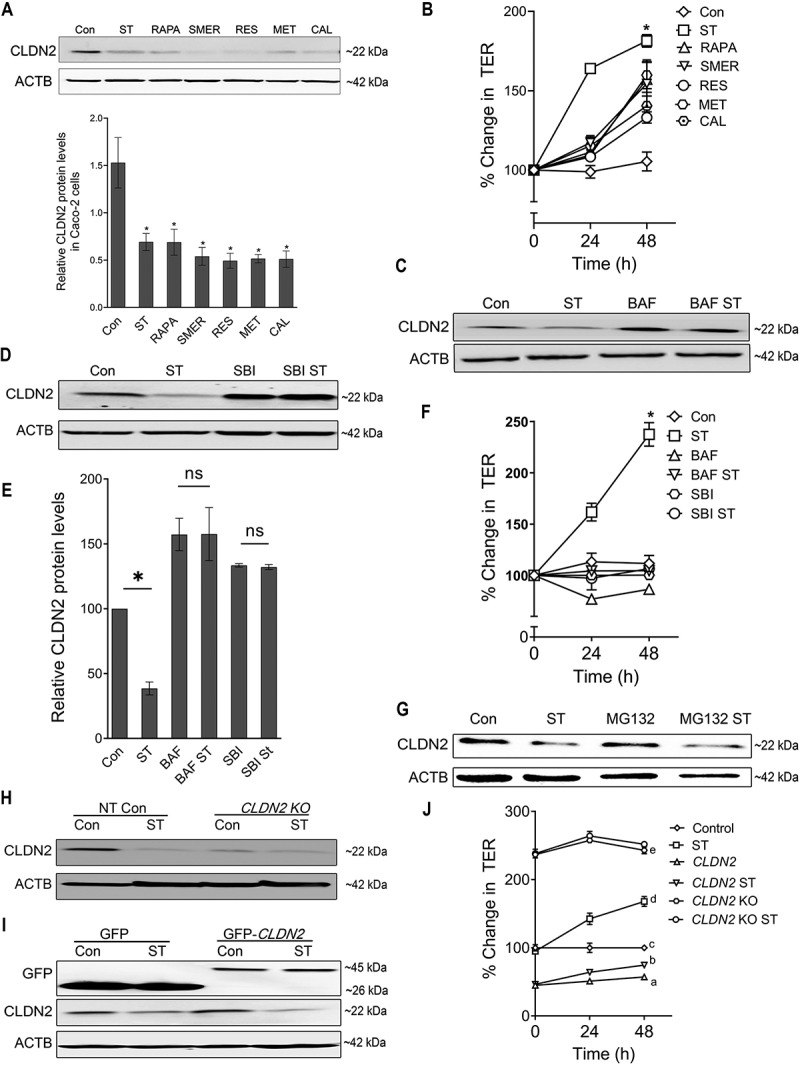
Autophagy-mediated reduction in CLDN2/Claudin-2 levels. (A) Confluent Caco-2 cells were incubated in EBSS for starvation (ST) or treated with known autophagy inducing compounds rapamycin (RAPA, 500 nM), small-molecule enhancer 28 (SMER, 50 µM), resveratrol (RES, 100 µM), metformin (MET, 100 µM), and calcitriol (CAL, 20 µM) for 24 h, and CLDN2 levels were measured by Western blotting. ACTB/β-actin is shown as a loading control. The protein levels of CLDN2 were reduced by all the autophagy inducers. ST: starvation. The densitometry analysis of CLDN2 expression was performed using ImageJ software to indicate the relative levels of CLDN2 after autophagy-inducing treatments. The graph is representative of ≥ 3 independent experiments (*, p < 0.005 versus control). (B) The autophagy-inducing treatments increased Caco-2 trans-epithelial resistance (TER) compared to untreated control group (*, p < 0.005 versus control). (C) Autophagy inhibitor bafilomycin A1 (BAF, 20 nM) treatment for 24 h alone increased CLDN2 levels and prevented starvation-induced decrease in CLDN2 levels. (D) Autophagy inhibitor SBI-0206965 (SBI, 30 µM) treatment for 24 h prevented starvation-induced decrease in CLDN2 levels. (E) Densitometry for CLDN2 expression in panel C and D. The graph is representative of ≥ 3 independent experiments (*, p < 0.05 versus control). BAF and SBI also prevented starvation-induced increase in TER (F) (*, p < 0.005 versus control). (G) Proteasomal inhibition with MG132 (10 µM) did not prevent starvation-induced reduction in CLDN2 levels. (H) Western blot showing CLDN2 knockout in CLDN2 KO Caco-2 cells. (I) Western blot showing GFP and CLDN2 GFP, confirming CLDN2 over expression in Caco-2 cells. Starvation induced no significant difference in the levels of exogenous CLDN2 but in contrast a significant decrease in endogenous CLDN2 upon starvation was seen in both Non-Target GFP and CLDN2 overexpressing Caco-2 cells. (J) CLDN2 overexpressed Caco-2 cells (CLDN2) showed reduced TER and CLDN2 KO showed increased TER at the baseline. CLDN2 KO cells did not show starvation-induced increase in TER, whereas CLDN2-overexpressing Caco-2 cells showed mild but significant increase in TER upon starvation. a, b, c, d, and e, P < 0.005 vs. each other in two-way ANOVA followed by Tukey’s multiple comparison test.