Figure 2.

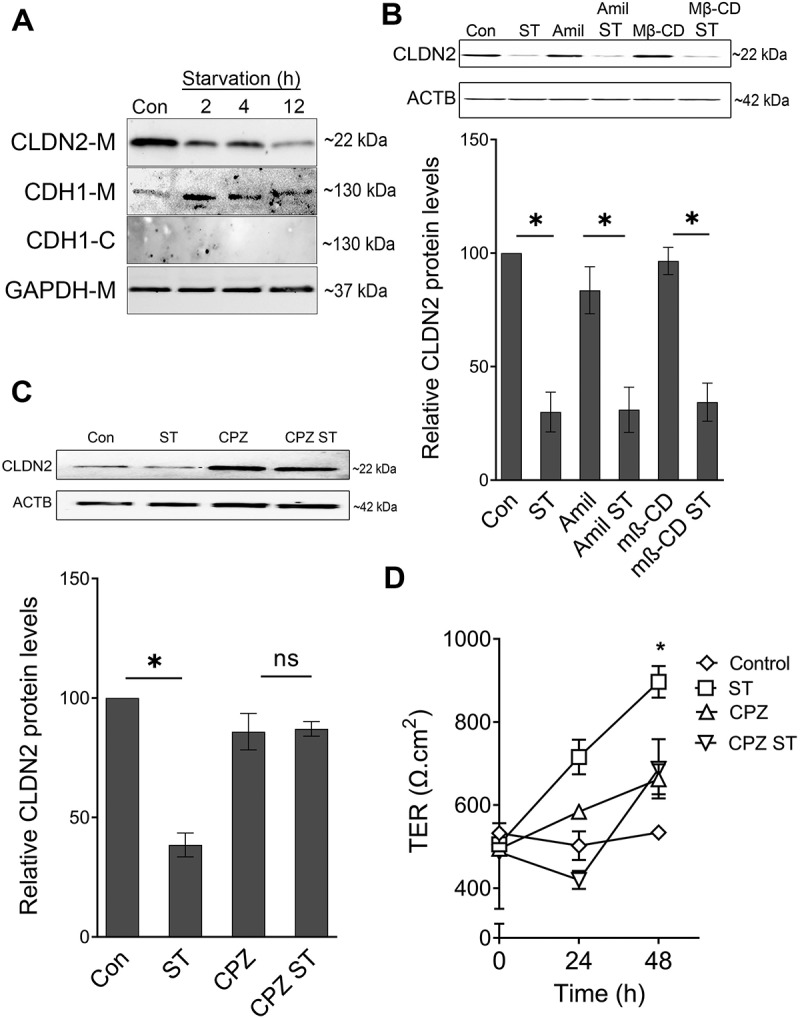
Autophagy-induced CLDN2 reduction is mediated via clathrin. (A) The amount of CLDN2 in membrane fraction is reduced gradually with increased starvation time period. E-cadherin-M and E-cadherin-C represents E-cadherin probes on cell membrane and cytoplasmic fractions, respectively. GAPDH is shown as a loading control for membrane fractions. The blots are representative of ≥ 3 independent experiments. (B) Amiloride (Amil, 10 µM) and Methyl-β-cyclodextrin (MβCD, 250 µM) treatment for 24 h did not alter starvation-induced reduction in CLDN2 levels. Densitometry for CLDN2 expression (*, p < 0.01 versus control). Clathrin inhibitor, chlorpromazine (CPZ, 10 µM) treatment for 24 h prevented starvation-induced reduction in CLDN2 levels (C). The densitometry representation (C) of CLDN2 expression after chlorpromazine treatment is also shown. (D) Chlorpromazine (CPZ, 10 µM) treatment for 24 h prevented starvation-induced increase in TER (*, p < 0.001 versus control) .
