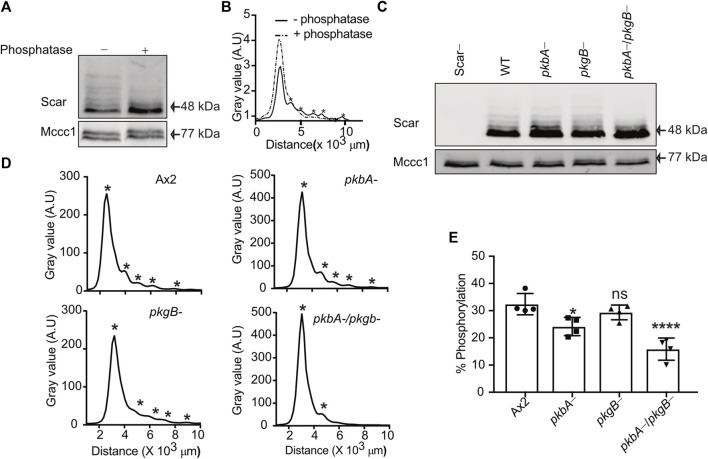
FIGURE 1.
Phosphorylation of Scar is diminished in Dictyostelium pkbA-/pkgB-. (A) Assay of Scar phosphorylation. Ax2 cell lysates treated with phosphatase were analyzed by western blotting. (B) Density quantification shows multiple peaks (solid line) resolved into one (dotted line) after phosphatase treatment. Asterisks at the peaks represents Scar bands. (C) Assay of Scar phosphorylation in Ax2, pkbA-, pkgB- and pkbA-/pkgB- cells. Whole cell lysates were analysed by western blotting. (D) Density quantification shows flattening of multiple peaks (asterisks) in pkbA-, pkgB-, and loss in pkbA-/pkgB-. (E) Shows ratio of upper (more-phosphorylated) band to aggregate intensity of total Scar (bars show mean ± SD, n = 4 independent experiment, *p ≤ 0.05, ****p ≤ 0.0001, One-way Annova, Dunnett’s multiple comparison test). Mccc1 was used as loading control.

