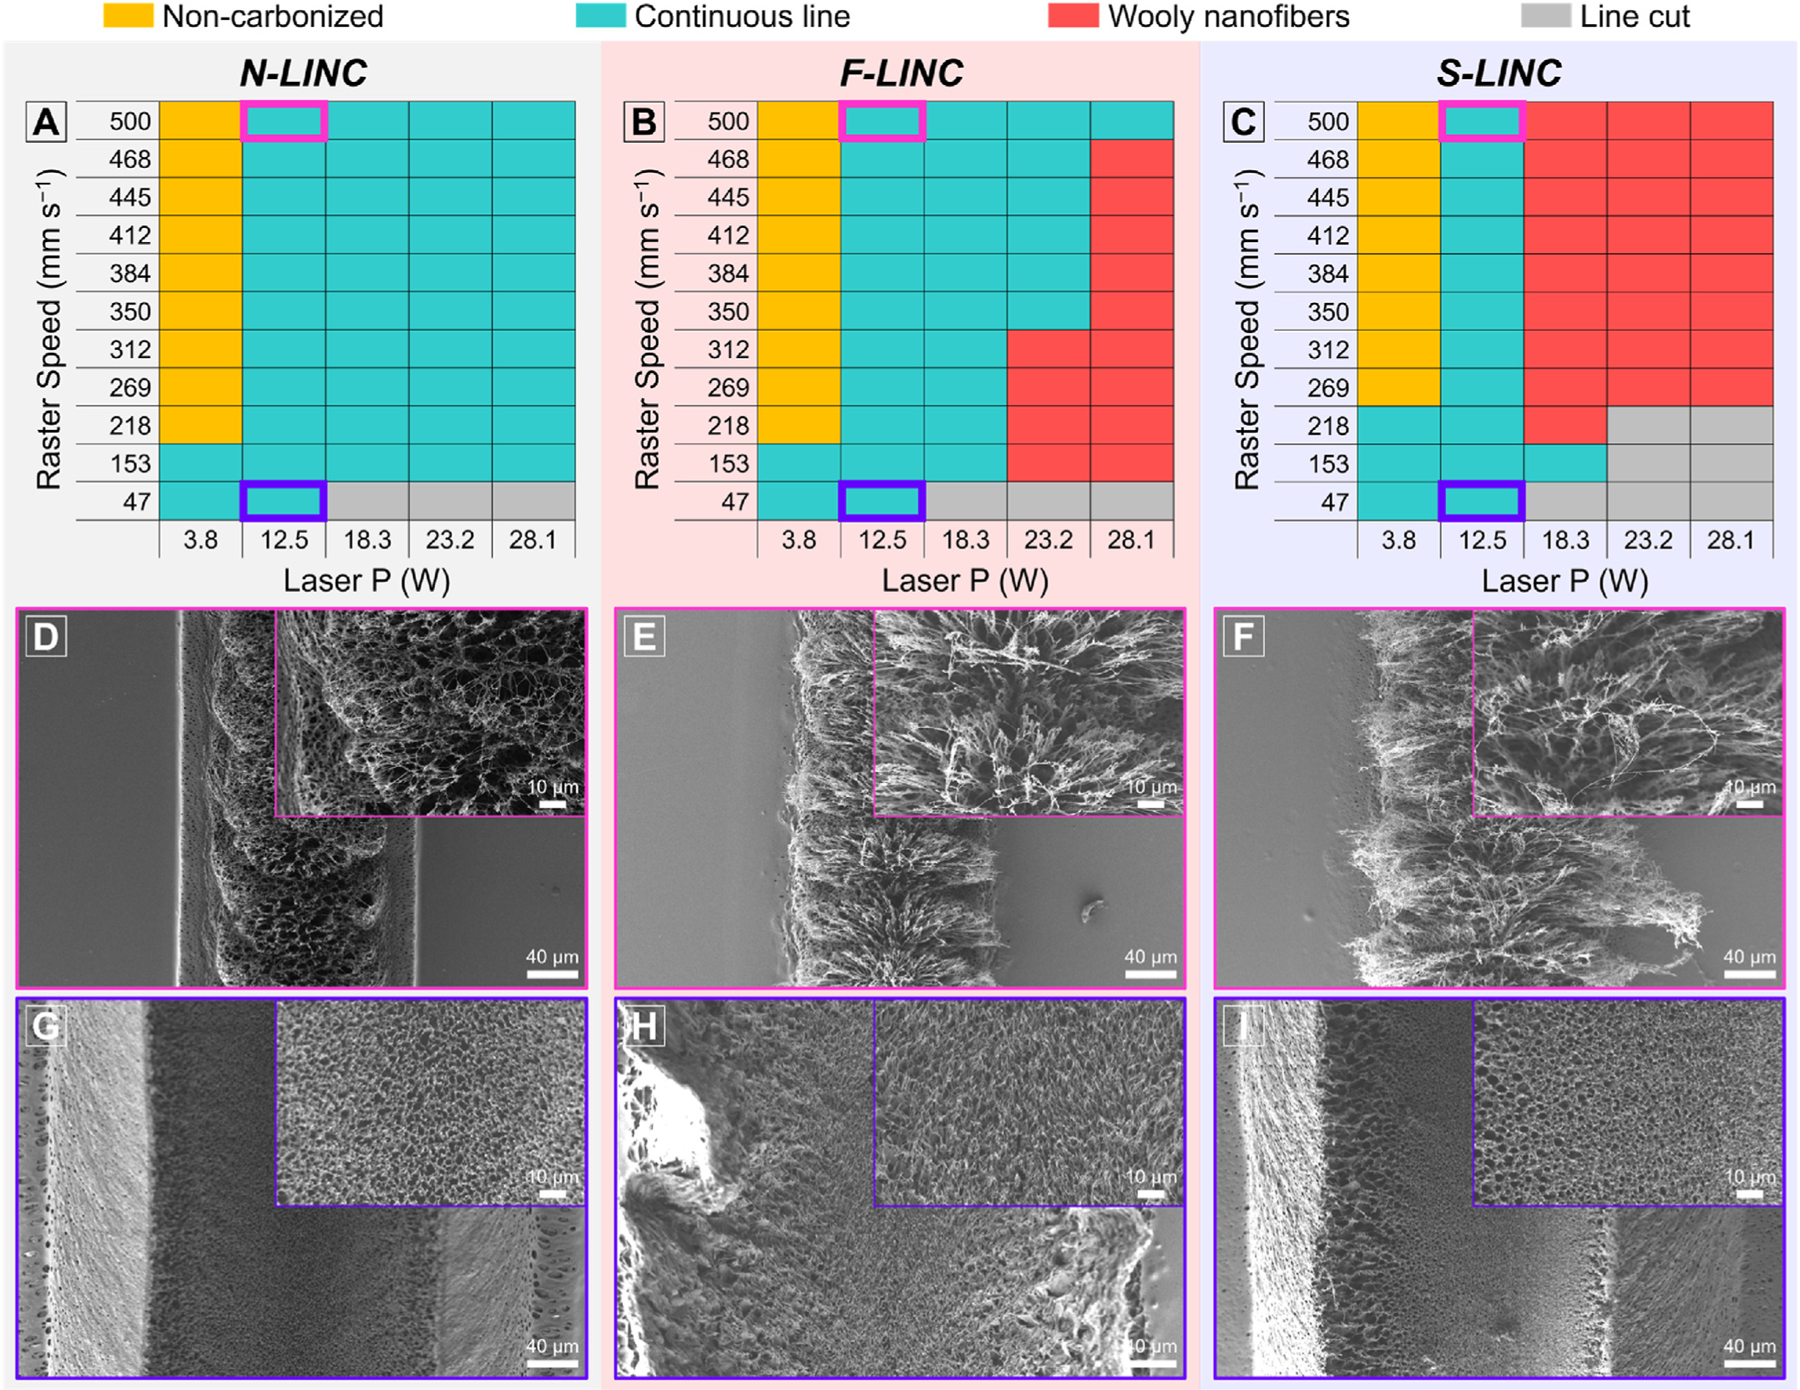
Fig. 2.

(a–c) Correlation map of laser power with raster speed on different PI backbones to achieve different doped LINC morphologies from the desired continuous lines of electrically conducting porous morphology (green) to resistive wooly nanofibers (red): (a) PMDA–ODA, (b) 6FDA–ODA, and (c) DSDA–ODA. SEM of LINC morphology for the conducting carbon lines fabricated at P = 12.5 W, S = 500 mm s−1 (laser fluence = 16 J cm−2): (d) N-LINC, (e) F-LINC, and (f) S-LINC. SEM of LINC morphology for the conducting carbon lines fabricated at P = 12.5 W, S = 47 mm s−1 (laser fluence = 170 J cm−2): (g) N-LINC, (h) F-LINC, and (i) S-LINC. Inset is the corresponding higher magnification SEM image.
