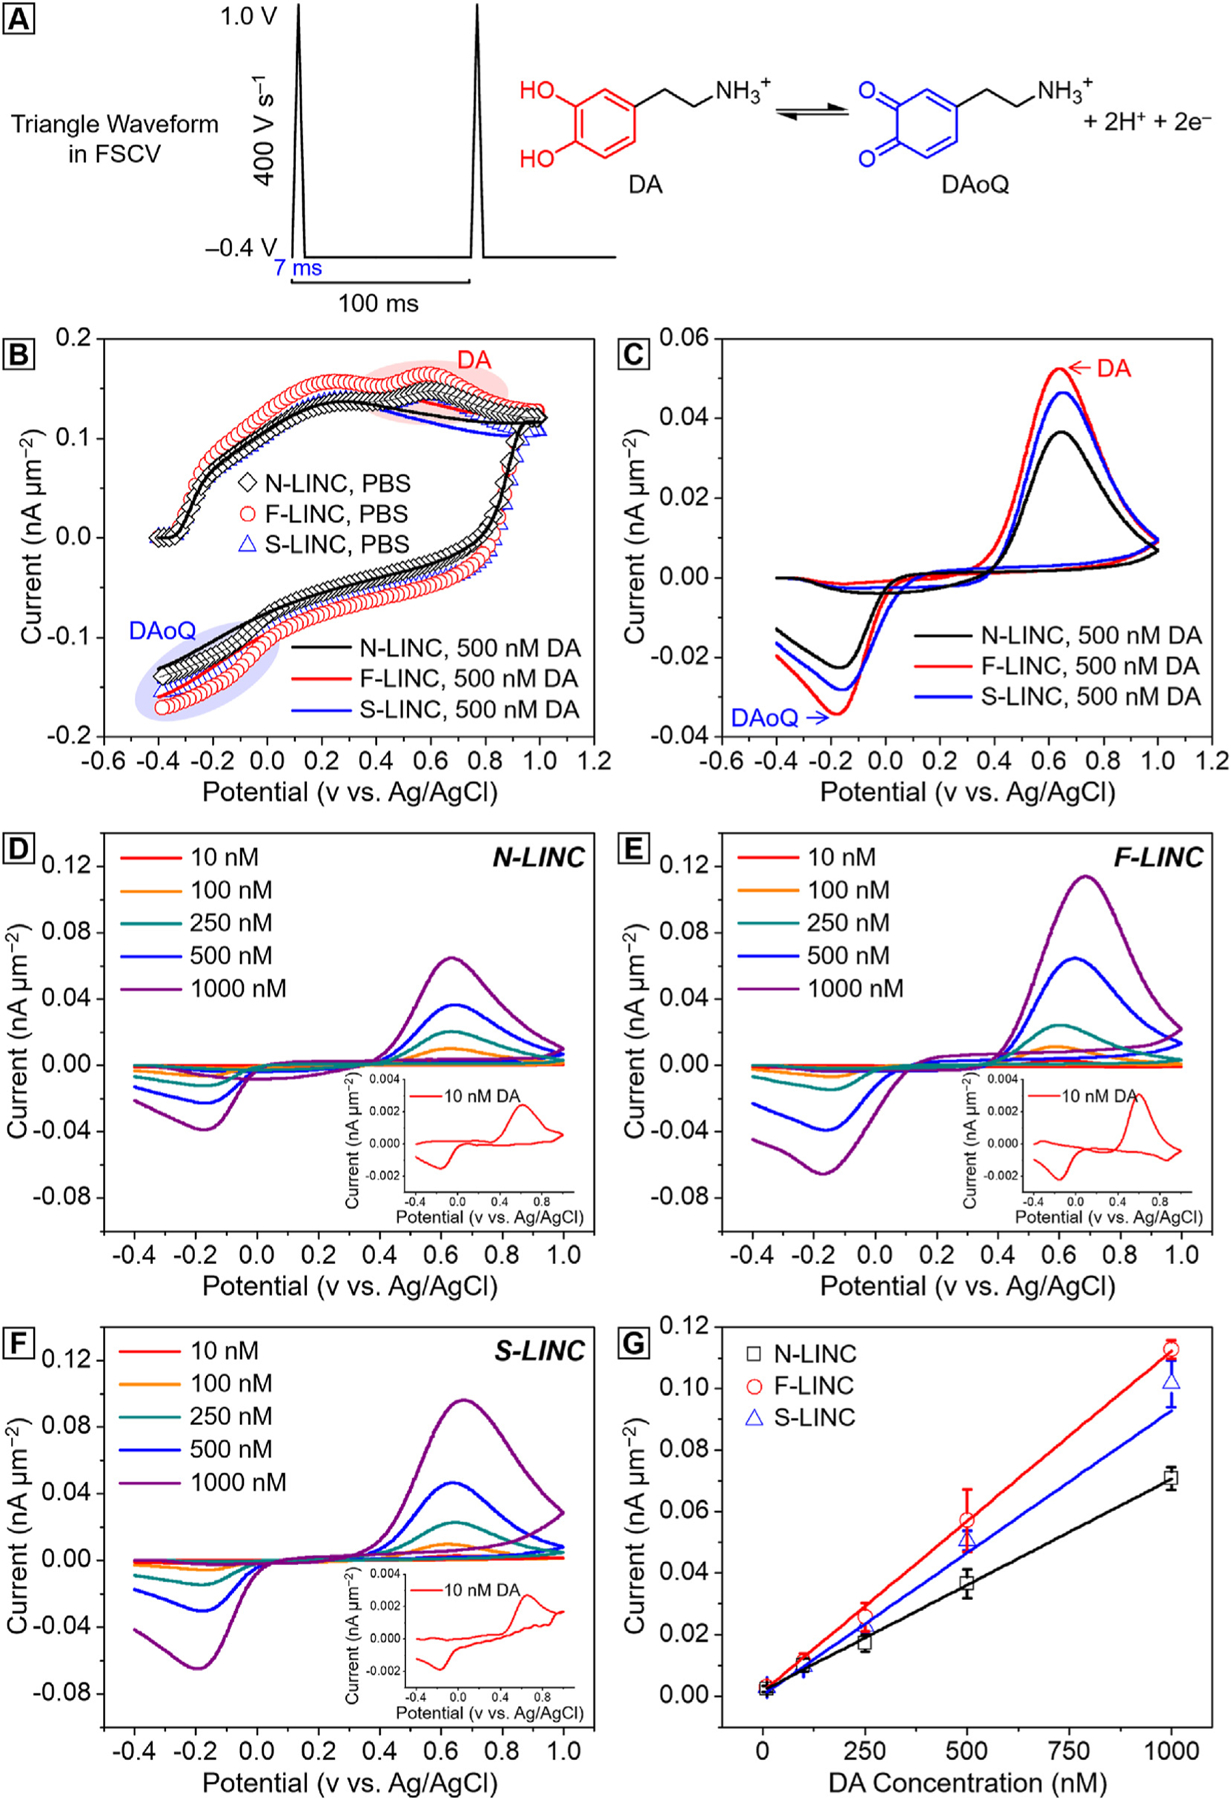
Fig. 5.

Dopamine sensitivity with three different doped LINC fabricated at P = 12.5 W, S = 47 mm s−1 (laser fluence = 170 J cm−2). (a) Schematic of the FSCV waveform used, with holding potential −0.4 V, swhitching potential 1 V at 400 V s−1, 10 Hz (left) and schematic of the two-electrons and two-protons DA reaction (right). (b) FSCV background current in PBS (lines) and in presence of 500 nM DA (scatters) for N-LINC (black), F-LINC (red), and S-LINC (blue) respectively; (c) corresponding background subtracted CVs, highlight the dopamine oxidation peaks and dopamine-o-quinone reduction peaks. Representative background subtracted CVs for 10, 100, 250, 500 nM and 1 μM bolus of DA injection collected using (d) N-LINC, (e) F-LINC, and (f) S-LINC, respectively. Inset: representative background subtracted FSCVs for 10 nM DA concentrations. (g) Calibration curves (10 nM–1.0 μM concentration range) of DA in PBS using N-LINC (black), F-LINC (red), and S-LINC (blue), respectively. Data were calibrated from 7 replicates (n = 7).
