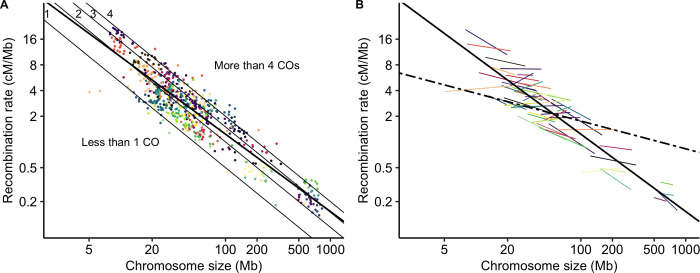
Fig 1. Mean recombination rates per chromosome (cM/Mb, log scale) are negatively correlated with chromosome physical size (Mb, log scale).
Each point represents a chromosome (n = 665). Species are presented in different colours (57 species). (A) The bold solid line represents the linear regression line fitted to the data. The thin lines correspond to the expectation of one, two, three or four COs per chromosome. (B) Correlations between recombination rates and chromosome size within each species with at least 5 chromosomes (coloured lines, 55 species) and the overall between-species correlation controlled for a species effect (black dashed line, n = 57 species). Solid bold line as in (A).

