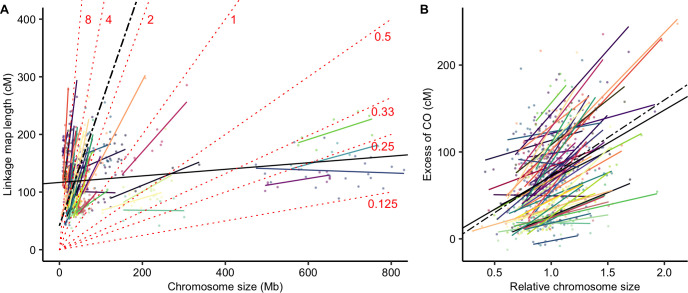
Fig 2. Linkage map length (cM) is positively correlated with genomic chromosome size (Mb).
(A) Correlation between chromosome genomic size (Mb) and linkage map length (cM). Each point represents a chromosome (n = 665). Species are presented in different colours (57 species). The black solid line represents the simple linear regression (linkage map length ~ log10(chromosome size), adjusted R2 = 0.036, p < 0.001) and the black dashed line the fixed effect of the mixed model (linkage map length ~ log10(chromosome size) + (1 | species), marginal R2 = 0.49, conditional R2 = 0.99, p < 0.001). Species random slopes are shown in colours. Isolines of recombination rates are plotted for different values (indicated cM/Mb) as dotted red lines to represent regions with equal recombination. (B) The excess of COs (linkage map length minus 50 cM for the obligate CO) is positively correlated with the relative chromosome size (size / average size of the species). The black solid line is the linear regression across species (excess of CO ~ relative chromosome size, adjusted R2 = 0.13, p < 0.001) and the black dashed line the fixed effect of the mixed model (excess of CO ~ relative chromosome size + (1 | species), marginal R2 = 0.14, conditional R2 = 0.86, p < 0.001). Coloured solid lines represent individual regression lines for species with at least 5 chromosomes (55 species).

