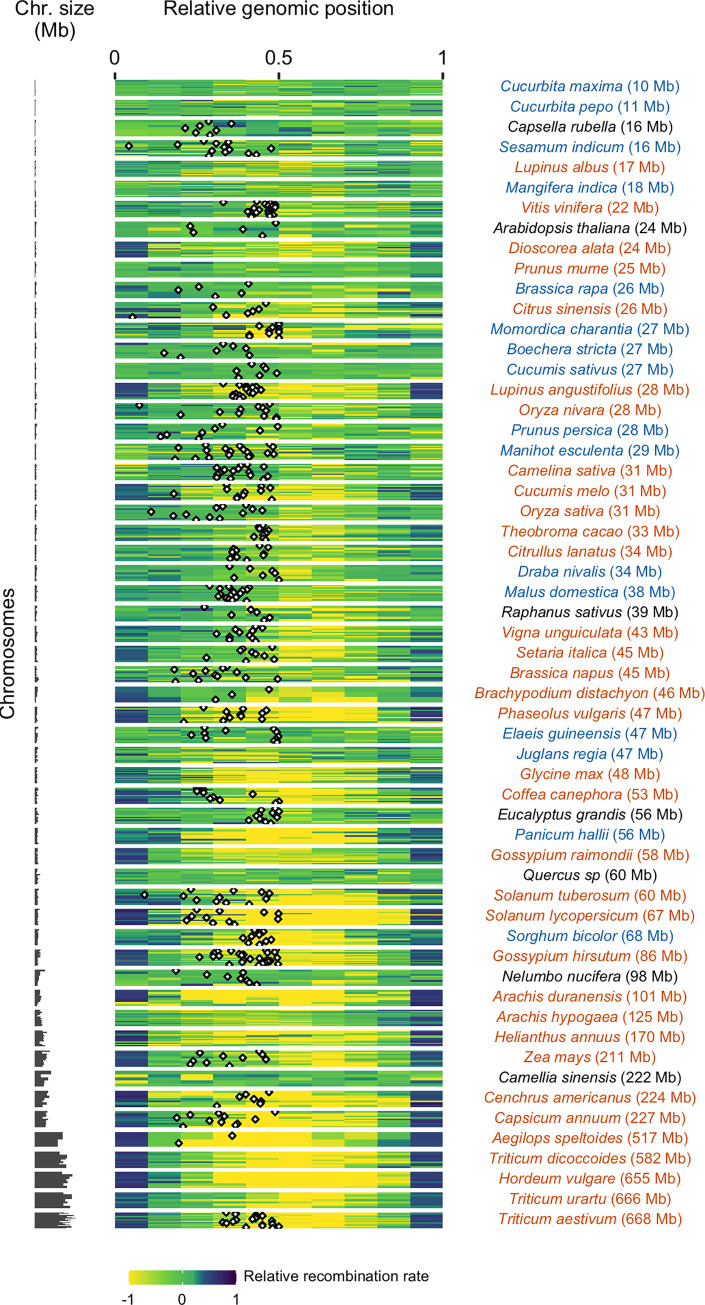
Fig 4. Patterns of recombination within chromosomes (n = 665).
Relative recombination rates along the chromosome were estimated in ten bins of equal ratio of the observed genetic length divided by the expected genetic length (one tenth of total size) of the bin (log-transformed). Values below (above) zero are recombination rates that are lower (higher) than expected under a random distribution. The 57 species are ordered by ascending genome size. Each horizontal bar plot represents one chromosome. When available, the centromere position is mapped as a black and white diamond.

