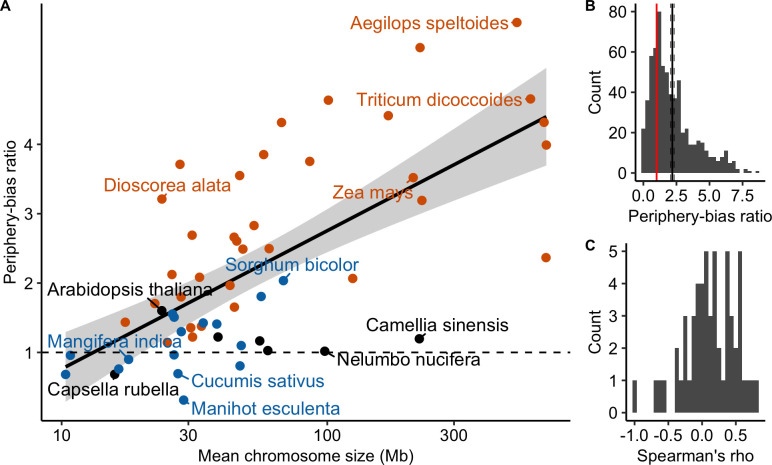
Fig 5. The periphery-bias ratio is positively correlated with chromosome genomic size.
(A) Linear regression between the species mean periphery-bias ratio and the mean chromosome size (log scale) across species (n = 57 species; adjusted R2 = 0.44, p < 0.001). Points are coloured according to the classification of the CO patterns described below (orange = distal, blue = sub-distal, black = unclassified). (B) Distribution of periphery-bias ratios (n = 665 chromosomes). The mean periphery-bias ratio and its 95% confidence interval (black solid and dashed lines) were estimated by 1,000 bootstrap replicates. The red vertical line corresponds to a ratio of one. (C) Distribution of Spearman’s correlation coefficients between the periphery-bias ratio and chromosome genomic size (Mb) within species (n = 57 species).

