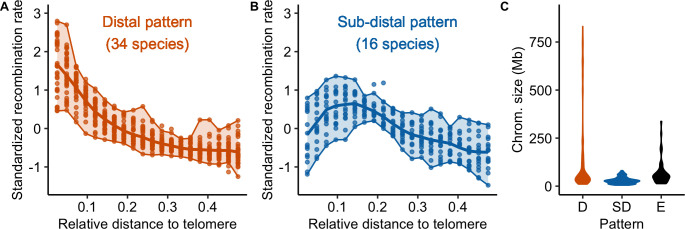
Fig 6. Distribution of crossover: main patterns.
(A and B) Standardized recombination rates for species (chromosomes pooled per species, n = 57 species) are expressed as a function of the relative genomic distance from the telomere in 20 bins representing the two main patterns (orange = distal, blue = sub-distal). The seven unclassified species are shown in supplementary (S7 Fig). Chromosomes were split in half and 0.5 corresponds to the centre of the chromosome. In each plot, the solid line represents the mean recombination rate estimated in a bin (20 bins) and each dot per bin represents the average of a species. Upper and lower boundaries of the ribbon represent the maximum and minimum values. (C) Distribution of chromosome genomic sizes (Mb) for each pattern (D: distal, SD: sub-distal, E: exceptions).

