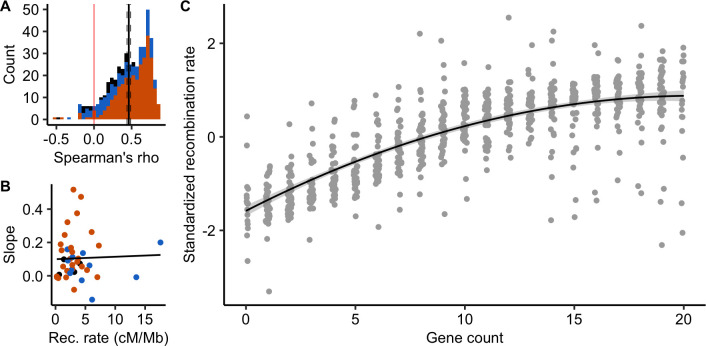
Fig 8. Recombination rates are positively correlated with gene density (n = 483 chromosomes, 41 species).
(A) Distribution of chromosome Spearman’s rank correlations between the number of genes and the recombination rate in 100 kb windows. The black vertical line is the mean correlation with a 95% confidence interval (dashed lines) estimated by 1,000 bootstrap replicates. Colours correspond to CO patterns (orange = distal, blue = sub-distal, black = exception). (B) Slopes of the species linear regression between gene count and recombination rates are independent of the species averaged recombination rate (Linear Model, adjusted R2 = -0.02, p = 0.83). (C) Standardized recombination rates for each number of genes in a 100 kb window (centred-reduced, chromosomes pooled per species) estimated by 1,000 bootstraps and standardized within species. The gene count was estimated by counting the number of gene starting positions within each 100 kb window. The black line with a grey ribbon is the quadratic regression estimated by linear regression with a 95% parametric confidence interval (Linear Model, adjusted R2 = 0.62, p < 0.001).

