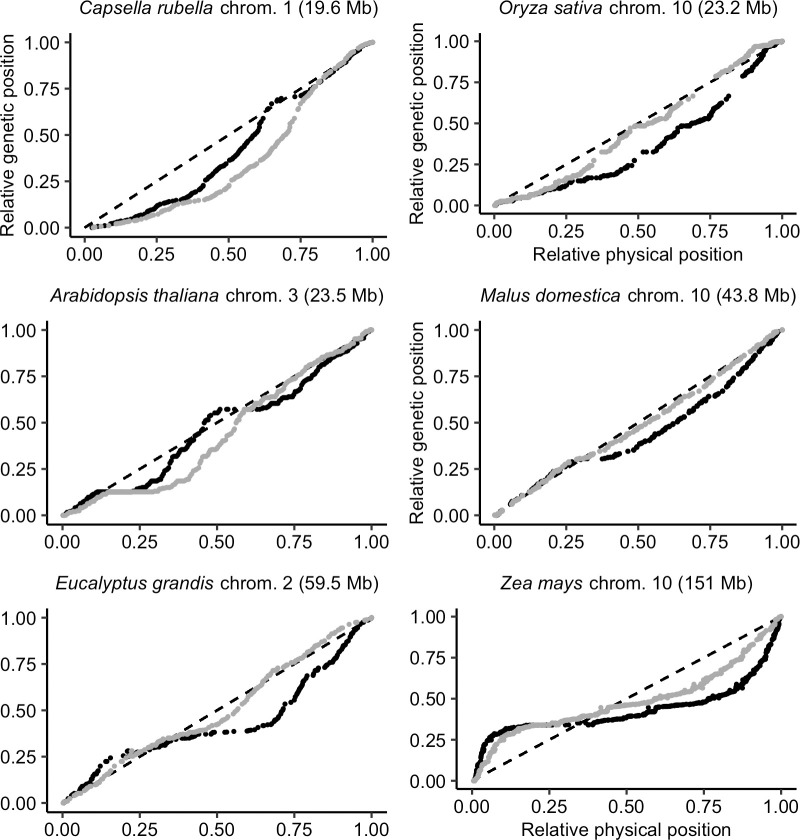
Fig 10. Marey maps of six chromosomes with the relative physical distance expressed in genomic distances (black dots, position in the genome in Mb) or in gene distances (grey dots, position measured as the cumulative number of genes along the chromosome).
Marey maps are ordered by ascending chromosome size (Mb). The diagonal dashed line represents a theoretical random distribution of COs along the chromosome.

