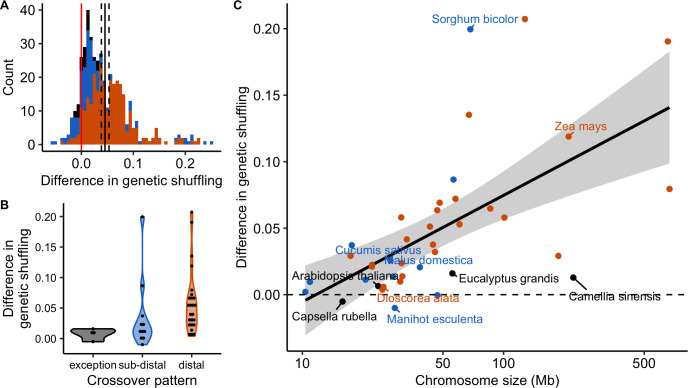
Fig 11. Differences in genetic shuffling between estimates based on genomic distances (Mb) and gene distances (cumulative number of genes).
The difference is the genetic shuffling in gene distances minus the genetic shuffling in genomic distances. Colours correspond to CO patterns (orange = distal, blue = sub-distal, black = exception). (A) Distribution of the chromosome differences in the genetic shuffling (n = 444 chromosomes). (B) Distributions of the species difference in the genetic shuffling (n = 41 species, chromosomes pooled). (C) Species differences in the genetic shuffling are positively correlated with the averaged chromosome size (Linear Model, adjusted R2 = 0.20, p = 0.002, n = 41, 95% parametric confidence interval).

