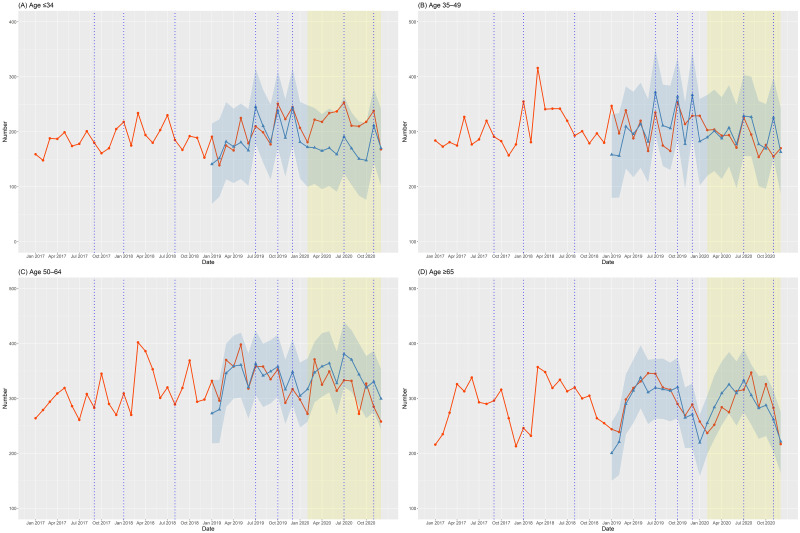
Fig 3. Observed and expected numbers of suicides by age group per month between 2017 and 2020 in Korea.
The red line with circles represents the observed number of suicides between 2017 and 2020. The blue line with triangles represents the expected number of suicides according to forecasting models and the surrounding blue area indicates the 95% confidence interval (with 2019 as the validation period). The blue vertical dotted lines indicate the dates of celebrity suicides.

