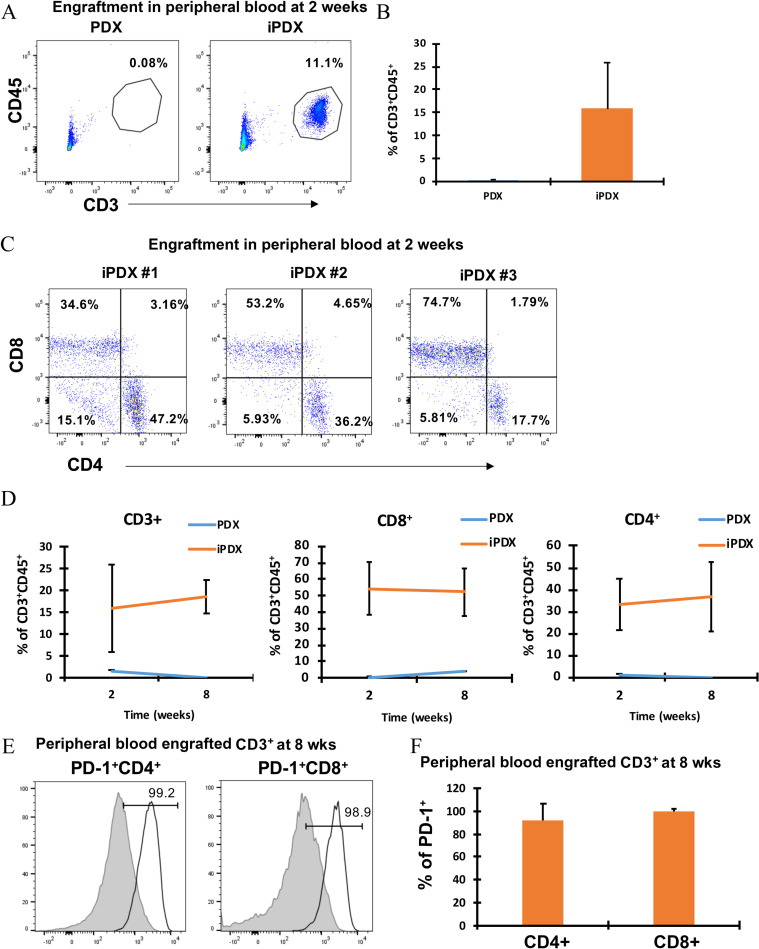
Fig 1. Effective engraftment of human PBMC derived T cells in MCC iPDX mouse peripheral blood.
(A) Representative flow cytometry plots are shown for MCC model CD3+CD45+ T lymphocytes from PDX mice (left), iPDX mice (middle). (B) Bar graph of the average % of CD3+CD45+ cells (right). Data from peripheral blood samples collected at 2 weeks. (C) Flow cytometry plots for CD4+ and CD8+ T lymphocytes from all iPDX mice (n = 3). Data from peripheral blood samples collected at 2 weeks. (D) The change in the average % of human T lymphocytes from early (2 week) to late (7 weeks) engraftment are shown for MCC CD3+CD45+ T lymphocytes (left), CD8+ T lymphocytes (middle) and CD4+ T lymphocytes (right). (E) PD-1+CD4+ T lymphocytes (left) PD-1+CD8+ T lymphocytes (right). T lymphocytes from healthy human donor PB (grey histogram, left) and iPDX PB (empty histogram, right). (F) Bar graph showing average percentage of PD-1+CD4+ and CD8+ T lymphocytes. Data from peripheral blood samples collected at 8 weeks. The values represent the percentage of human CD3, CD4 and CD8 population in iPDX mice peripheral blood. Average of per group (n = 3) is shown.

