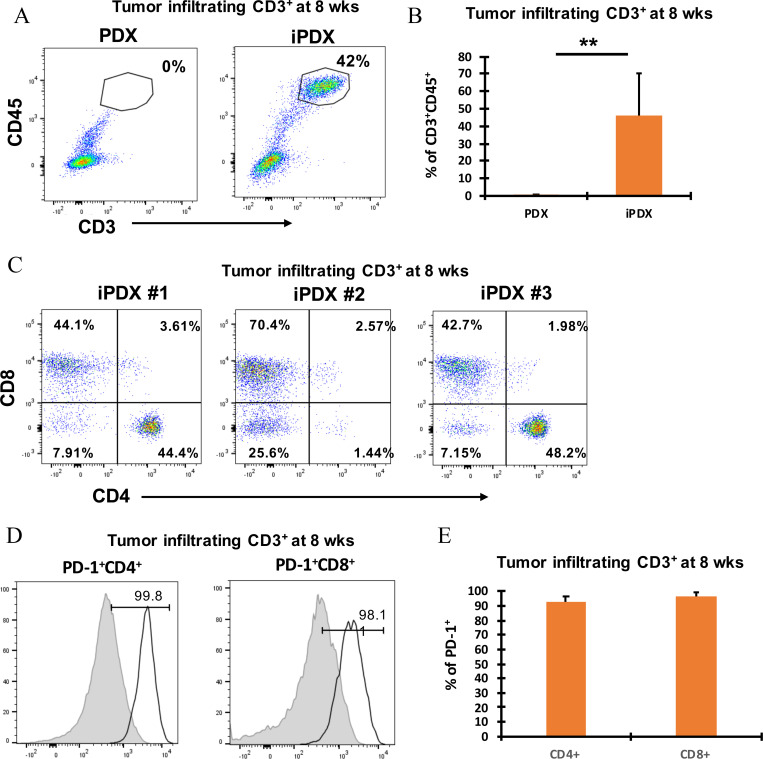
Fig 3. Identification and phenotypic characterization of MCC iPDX tumor derived human CD3+ T cells.
(A) Representative flow cytometry dot plots showing CD3+CD45+ tumor infiltrating lymphocytes (TILs) (top left); (B) Bar graph of average values (top right). Data from samples collected at 8 weeks. (C) CD4+ and CD8+ TILs from 3 individual MCC iPDX mouse tumors (bottom panel). Data from samples collected at 8 weeks. (D) PD-1+CD4+ TILs (left) and PD-1+CD8+ TILs (middle) from a representative MCC iPDX mouse tumor. T lymphocytes from non-cancer human donor PB obtained from phlebotomy lab (grey histogram, left) and TILs from iPDX tumor (empty histogram, right). (E) Bar graph showing average percentage of PD-1+CD4+ and CD8+ T lymphocytes from 3 individual MCC iPDX mouse tumors. Data from samples collected at 8 weeks. Values represent mean of three animals per group ± SD. **p < 0.005.

