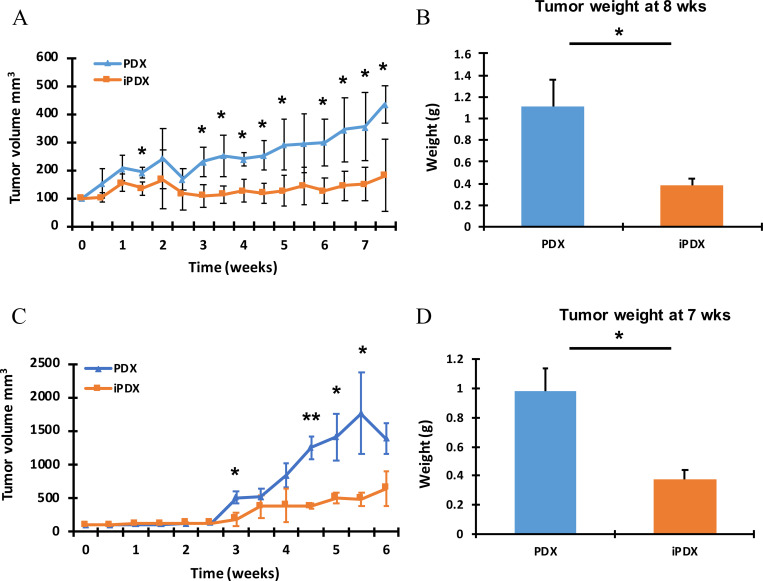
Fig 4. iPDX demonstrate reduced tumor growth compared with the corresponding PDX.
Tumor (A) Average tumor volume (mm3) measured over time in the MCC model. (B) Final tumor weight (g) average in the MCC model. Data from samples collected at 8 weeks. (C) Average tumor volume (mm3) measured over time in the MPC model. (D) Final tumor weight (g) average in the MPC model. Data from samples collected at 7 weeks. Values represent mean of three animals per group ± SD. *p < 0.05. **p < 0.005.

