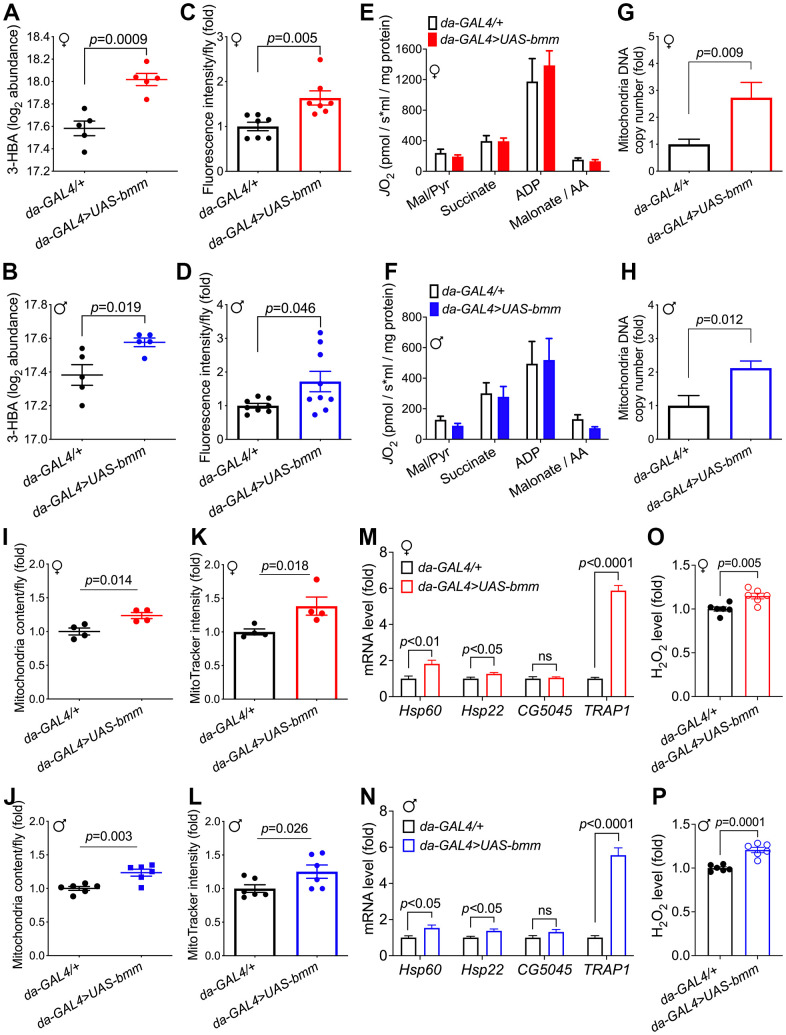
Figure 5.
bmm overexpression increases mitochondrial biogenesis and oxidative metabolism. (A, B) Level of 3-hydroxybutyrate (log2 abundance) in da-GAL4/+ vs. da-GAL4>UAS-bmm flies. n=5 replicates, and each replicate contained 20 flies. FDR=0.0008 for bmm overexpression vs. control females, and FDR=0.13 for males. (C, D) β-oxidation rate measurement using fatty acid oxidation direct detection reagent, FAOblue (10 μM for 1 hour incubation). Each group consists of n=7-9 replicates, and each replicate sample was extracted from 20 flies. Data are shown as mean±SEM. Statistical analysis was carried out by two-tailed Student t-test in (A–D). (E, F) Oxygen consumption rate measurements of isolated mitochondria from da-GAL4/+ and da-GAL4>UAS-bmm flies, when stimulated by indicated reagents. Data are shown as mean±SEM and normalized by mitochondria protein. Statistical analysis was carried out by two-way ANOVA. n=5-6 replicates, and each replicate contained mitochondria extracted from 50 flies. Mal/Pyr: malate + Pyruvate; AA: antimycin A. (G, H) Quantification of mitochondrial DNA copy number in da-GAL4/+ vs. da-GAL4>UAS-bmm flies. Data are shown as fold change of mitochondrial Cytb DNA normalized to nuclear histone DNA. n=6-11 replicates, and each replicate was extracted from 10 flies. (I, J) Quantification of mitochondrial content in da-GAL4/+ vs. da-GAL4>UAS-bmm flies. n=4 replicates for females, and n=6 replicates for males. Mitochondria were isolated from 50 flies for each replicate, and protein content was quantified by BCA analysis. (K, L) MitoTracker intensity measurement of da-GAL4/+ vs. da-GAL4>UAS-bmm flies to assess mitochondrial mass. n=4 replicates for females, and n=6 replicates for males with 50 flies for each replicate. (M, N) Mitochondrial UPR genes mRNA expression level measurement in da-GAL4/+ vs. da-GAL4>UAS-bmm flies. n=7-11 replicates. (O, P) H2O2 level measurement in da-GAL4/+ vs. da-GAL4>UAS-bmm flies. n=6 replicates. Data are shown as mean±SEM. Statistical analysis was carried out by two-tailed Student t-test. See also Supplementary Figure 6.

