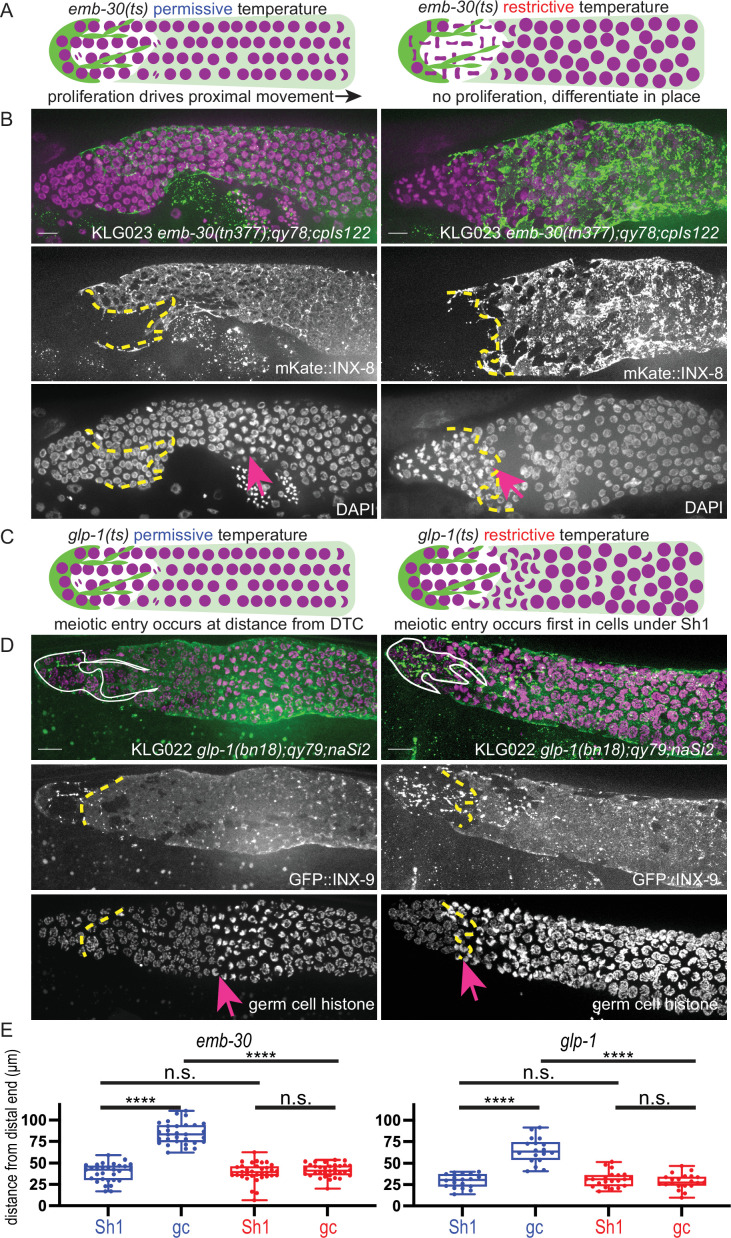
Figure 1. The Sh1 cells associate with proliferative germ cells that are on the path to differentiation.
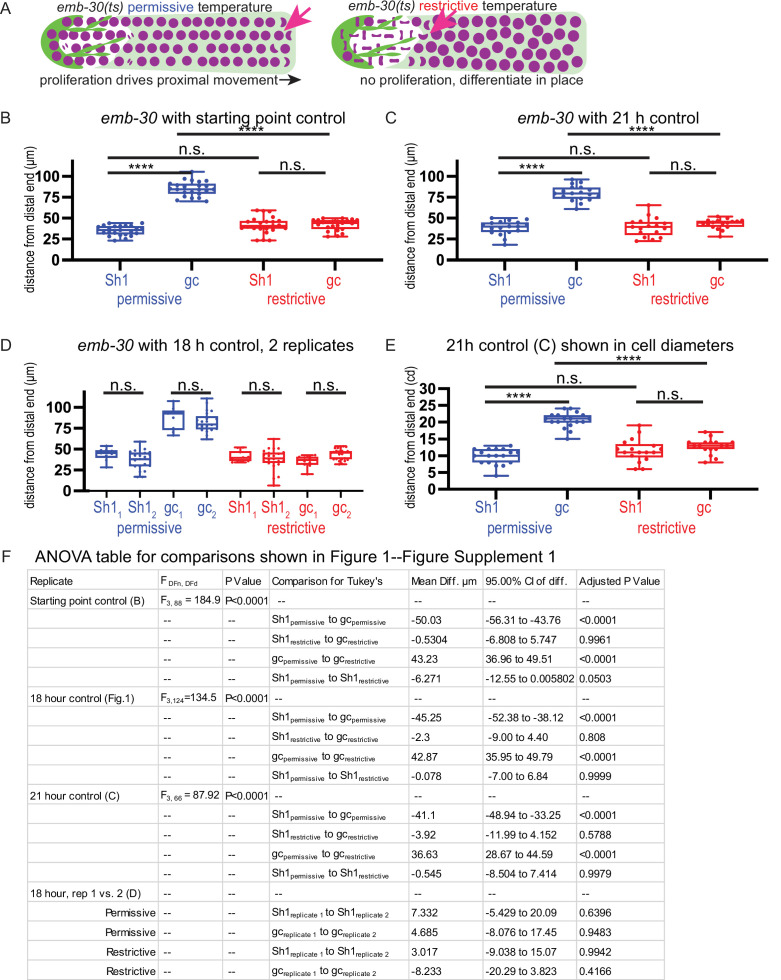
(A) Schematic of hypothesis for emb-30(tn377) experiment. Germ cell (gc) nuclei shown in magenta, somatic gonad cells shown in green (distal tip cell [DTC]), and transparent green (Sh1). (B) Gonads from KLG023 emb-30(tn377);qy78;cpIs122 worms reared at permissive (left column) and restrictive (right column) temperatures. Top, merged image. Middle, mKate::INX-8 labeling Sh1 (edge outlined with yellow dashed line). Bottom, DAPI staining labeling all nuclei with pink arrow marking gc transition and same yellow dashed line as in middle image showing Sh1 edge. (C) Schematic of hypothesis for glp-1(ts) experiment. (D) Gonads from KLG022 glp-1(bn18);qy79;naSi2 worms reared at permissive (left column) and restrictive (right column) temperatures. Top, merged image. Middle, GFP::INX-9 labeling DTC (outlined in white) and Sh1 (edge outlined with yellow dashed line). Bottom, germ cell histone mCherry (naSi2[mex-5p::H2B::mCherry]) with pink arrow showing gc transition and same yellow dashed line as in middle image showing Sh1 edge. Note that the glp-1(bn18) allele is not fully wild type at permissive temperatures and is known to have a shortened proliferative zone (Fox and Schedl, 2015). (E) Box plots overlaid with all datapoints measuring the distal position of Sh1 and the position of the transition zone in germ cell nuclear morphology. Permissive temperature shown in blue; restrictive temperature shown in red. Permissive emb-30 N=30; restrictive emb-30 N=34. Permissive glp-1 N=18; restrictive glp-1 N=21. A one-way ANOVA to assess the effect of temperature on proximodistal position of gonad features was performed, and was significant for emb-30: F3,124=134.5, p<0.0001. Tukey’s multiple comparison test found that the mean values of the positions of Sh1 and the germ cell transition zone were significantly different at the permissive temperature (mean difference of –45.25 μm, 95% CI –52.38 to –38.12 μm, p<0.0001), but not at the restrictive temperature (mean difference of –2.30 μm, 95% CI –9.00 to 4.40 μm, p=0.808). The position of the germ cell transition zone differed at the permissive vs. restrictive temperatures (mean difference of 42.87 μm, 95% CI 35.95 to 49.79 μm, p<0.0001), but the Sh1 position did not (mean difference of –0.078 μm, 95% CI –7.00 to 6.84 μm, p>0.9999). This pattern is observed across replicates and various controls (Figure 1—figure supplement 1). Similar results were obtained for glp-1: F3,74=52.84, p<0.0001. Tukey’s multiple comparison test found that the mean values of the positions of Sh1 and the germ cell transition zone were significantly different at the permissive temperature (mean difference of –35.51 µm, 95% CI –44.59 to –26.43 µm, p<0.0001) but not at the restrictive temperature (mean difference of 2.514 µm, 95% CI –5.892 to 10.92 µm, p=0.861). The position of the germ cell transition zone differed at permissive vs. restrictive temperatures (mean difference of 36.02 µm, 95% CI 27.27 to 44.77 µm, p<0.0001), but the Sh1 position did not (mean difference of –1.997 µm, 95% CI –10.75 to 6.753 µm, p=0.9318). All scale bars 10 µm.


