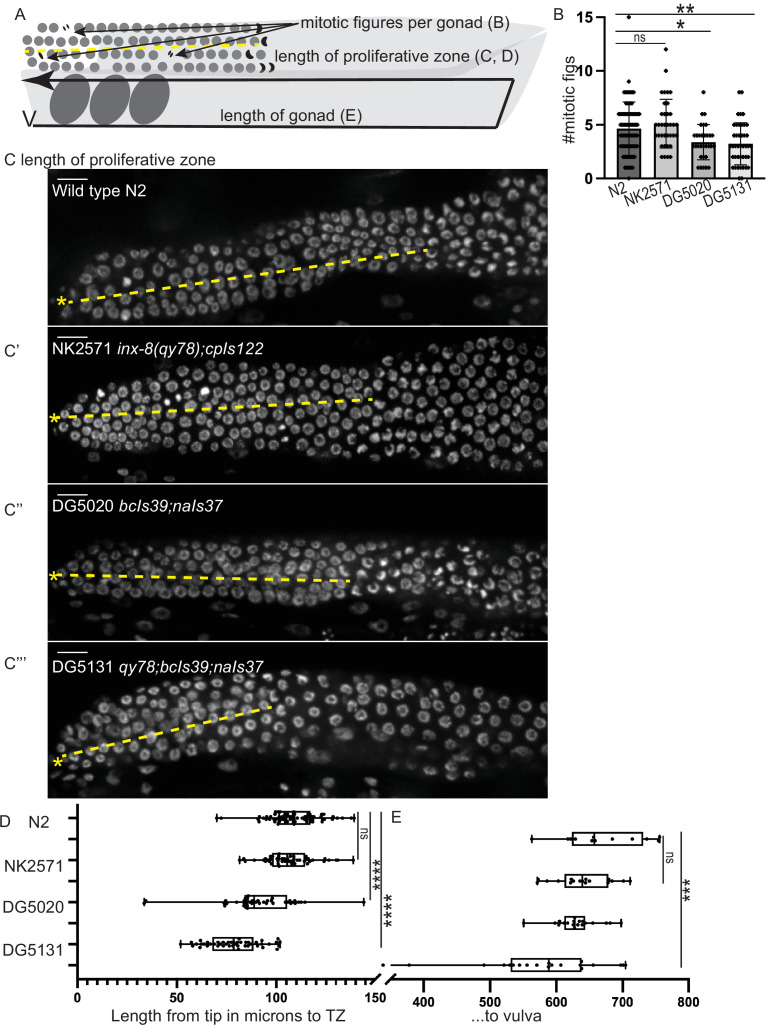
Figure 5. A synthetic interaction between lim-7p::ced-1::GFP and the tagged innexin qy78 shortens the proliferative zone.
(A) Illustration of measurements made for Figure 5. (B) Number of mitotic figures observed in DAPI stained animals of the four strains. Numbers of dividing cells and gonads examined are as follows: wild-type N2 (N=311 dividing cells/67 gonads), the NK2571 strain with the tagged innexin qy78 (N=184 dividing cells/36 gonads), the DG5020 strain with lim-7p::ced-1::gfp (N=105 dividing cells/31 gonads), the DG5131 strain combining these sheath markers (N=136 dividing cells/42 gonads). A one-way ANOVA to determine the effect of genotype on number of mitotic figures was significant F3, 172=7.081, p=0.0002. Tukey’s multiple comparison test revealed that NK2571 did not differ from wild type (mean difference –0.47 cells per gonad, 95% CI –1.65 to 0.71, p=0.7291), DG5020 differed from wild type by 1.26 germ cells per gonad, 95% CI 0.02–2.50, p=0.0453, and DG5131 differed from wild type (mean difference of 1.40 cells per gonad, 95% 0.28–2.52, p=0.0075). (C-C””) DAPI stained distal gonads for measurement of proliferative zone for the four strains. Asterisk marks tip of gonad, dashed line marks example of lengths measured. (C) Wild-type N2 (N=68), (C’) the NK2571 strain with the tagged innexin qy78 (N=49), (C”) the DG5020 strain with lim-7p::ced-1::gfp (N=40), (C”’) and the DG5131 strain combining these sheath markers (N=45). Asterisk marks tip of gonad. (D) Plots of proliferative zone length (left) and whole gonad length (right) for the four strains. A one-way ANOVA to determine the effect of genotype on length of proliferative zone was significant F3,198=49.15, p<0.0001. Tukey’s multiple comparison test revealed that NK2571 did not differ from wild type (mean difference 2.69 μm, 95% CI –4.283 to 9.663 μm, p=0.750), DG5020 differed from wild type by ~2–5 germ cell diameters (mean difference of 17.94 μm, 95% CI 10.53 to 25.36 μm, p<0.0001), and DG5131 dramatically differed from wild type (mean difference of 30.36 μm, 95% CI 23.21 to 37.51 μm, p<0.0001). The proliferative zone length of DG5131 was also significantly different from both of its parent strains (NK2571 vs. DG5131 mean difference of 27.67 μm, 95% CI 19.99 to 35.35 μm, p<0.0001; DG5020 vs. DG5131 mean difference of 12.42 μm, 95% CI 4.331 to 20.50 μm, p=0.0006). (E) Plots of length of entire gonad from tip to vulva. N2 (N=12), NK2571 (N=17), DG5020 (N=19), DG5131 (N=20). A one-way ANOVA to determine the effect of genotype on gonad length was significant F3,64=6.27, p=0.0009. Tukey’s multiple comparison test revealed that NK2571 did not differ from wild type (mean difference 31.16 μm, 95% CI –32.99 to 95.32 μm, p=0.578), DG5020 also did not differ from wild type (mean difference of 39.42 μm, 95% CI –23.32 to 102.2 μm, p=0.3546), and DG5131 did differ from wild type (mean difference of 95.15 μm, 95% CI 33.02 to 157.3 μm, p=0.0008). All scale bars 10 μm.

