. 2022 Sep 12;11:e75515. doi: 10.7554/eLife.75515

Figure 2. Stimulus–response correlation and stimulus–response coherence are tempo dependent for all musical features.

(A) Projected topography of the first reliable component (RC1). (B) Average SRCorr of the aligned neural response and surrogate distribution (grey) across tempi for each musical feature (left) and the z-scored SRCorr based on a surrogate distribution (right) (± SEM; shaded area). Highest correlations were found at slow tempi (repeated-measure ANOVA, Greenhouse-Geiser correction where applicable). The slopes of regression models were used to compare the tempo-specificity between musical features. (C) Mean SRCorr across musical features. Highest correlations were found in response to spectral flux with significant differences between all possible feature combinations, pFDR <0.001, except between the envelope or derivative and beat onsets, pFDR <0.01 (n=34, repeated-measure ANOVA, Tukey’s test, median, 25th and 75th percentiles). Z-scored SRCoh in response to the (D) amplitude envelope, (E) first derivative, (F) beat onsets and (G) spectral flux. Each panel depicts the SRCoh as colorplot (left) and the pooled SRCoh values at the stimulation tempo and first harmonic (right, n=34, median, 25th and 75th percentile). (H) Same as (C) for the SRCoh with significant differences between all possible feature combinations (pFDR <0.001) apart between the envelope and beat onsets. Coherence values were averaged over the stimulus tempo and first harmonic. (I) Mean differences of SRCoh values at the stimulation tempo and first harmonic (n=34, negative values: higher SRCoh at harmonic, positive values: higher SRCoh at stimulation tempo, paired-sample t-test, pFDR <0.05). (J) Same as (I) based on the FFT amplitudes (pFDR <0.001).

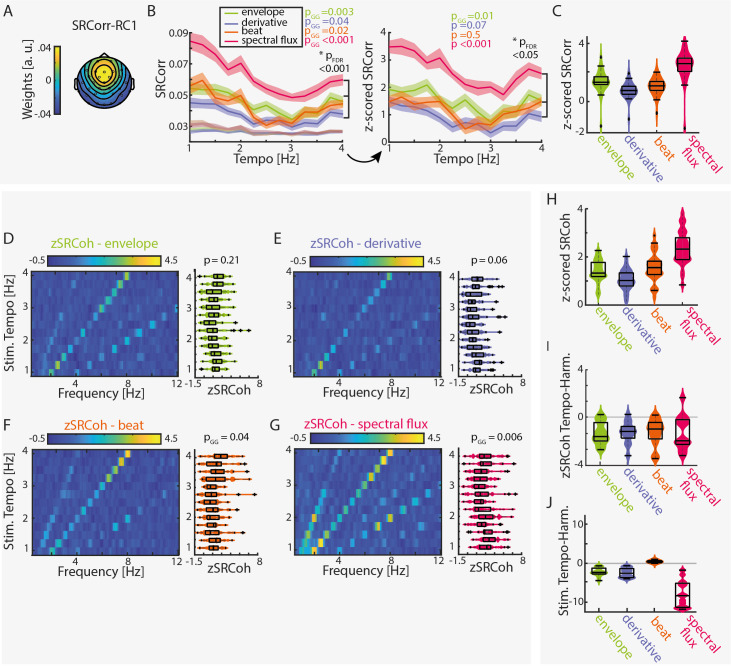
Figure 2—source data 1. Source data for the RCA-based measures stimulus-response correlation (SRCorr) and stimulus-response coherence (SRCoh).
Figure 2—source data 2. Output of the RCA-based analysis of the first two stimulation subgroups (based on Kaneshiro et al., 2020).
Figure 2—source data 3. Output of the RCA-based analysis of the last two stimulation subgroups (based on Kaneshiro et al., 2020).

Figure 2.

Figure 2—figure supplement 1. SRCorr and SRCoh in response to the full-band amplitude envelope and derivative.

Figure 2—figure supplement 1.

(A) Mean SRCorr across stimulation tempi and musical features (± SEM). Similar to Figure 2B of the main manuscript, the full-band amplitude envelope (Hilbert transform) and resultant first derivative were used. Significance between tempi was assessed using a repeated-measure ANOVA (with Greenhouse-Geiser correction if applicable). (B) SRCorr across musical features. Statistically significant differences were identified between all musical feature combinations except between the envelope and beat onsets using a repeated-measure ANOVA (pFDR <0.001, median, 25th and 75th percentiles). (C) Colormap of the fast Fourier Transform (FFT) of the first reliable component (RC1) across stimulation tempi. Note that the colorbar is in a logarithmic scale.
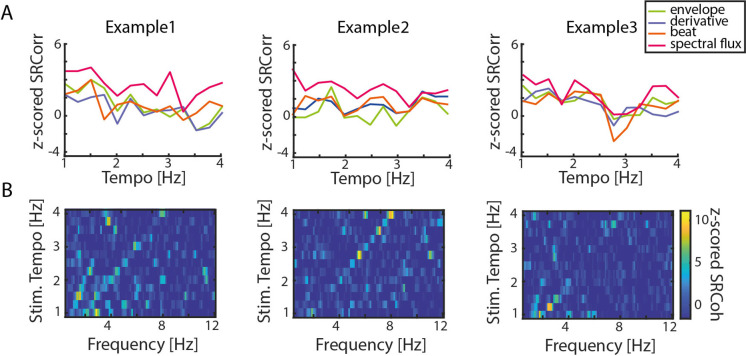
Figure 2—figure supplement 2. Individual data examples for the SRCorr and SRCoh.

Figure 2—figure supplement 2.

(A) Each plot shows the mean z-scored SRCorr of one participant across stimulation tempi. Each line represents the average of one musical feature (± SEM). (B) Illustrative color plots of the normalized SRCoh in response to the spectral flux across stimulation tempi (1–4 Hz) of the same four participants as in (A). Z-scoring was based on the surrogate distribution.