. 2022 Sep 12;11:e75515. doi: 10.7554/eLife.75515

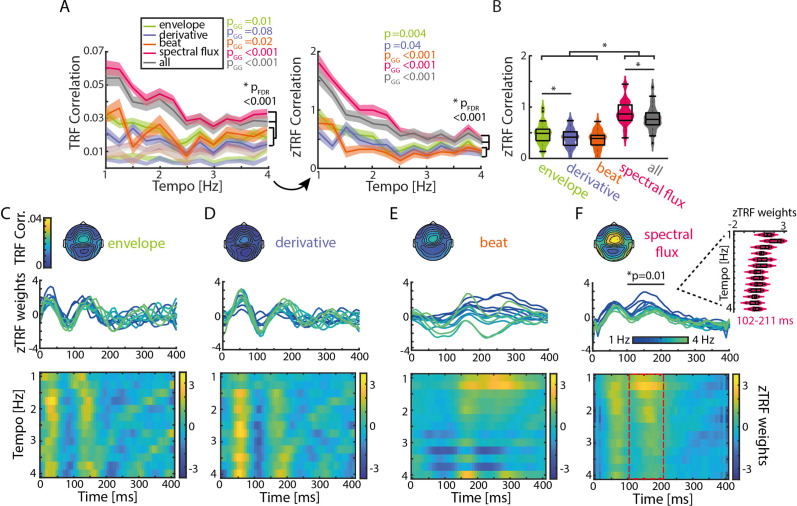
Figure 3. TRFs are tempo dependent.

(A) Mean TRF (± SEM) correlations as a function of stimulation tempo per stimulus feature (p-values next to the legend correspond to a repeated-measure ANOVA across tempi for every musical feature and the p-value below to the slope comparison of a linear regression model). TRF correlations were highest for spectral flux and combined musical features for slow tempi. The TRF correlations were z-scored based on a surrogate distribution (right panel). (B) Violin plots of the TRF correlations across musical features. Boxplots illustrate the median, 25th and 75th percentiles (n=34). Significant pairwise musical feature comparisons were calculated using a repeated-measure ANOVA with follow-up Tukey’s test, *pFDR <0.001. (C) Top panel: Topographies of the TRF correlations and TRF time lags (0–400ms) in response to the amplitude envelope. Each line depicts one stimulation tempo (13 tempi between 1 Hz, blue and 4 Hz, green). Lower panel: Colormap of the normalized TRF weights of the envelope in the same time window across stimulation tempi. (D) Same as (C) for the first derivative, (E) beat onsets and (F) spectral flux. Cluster-based permutation testing was used to identify significant tempo-specific time windows (red dashed box, p<0.05). Inset: Mean TRF weights in response to the spectral flux for time lags between 102 and 211ms (n=34, median, 25th and 75th percentile).

Figure 3—source data 1. Source data of the TRF correlations and weights.

Figure 3.

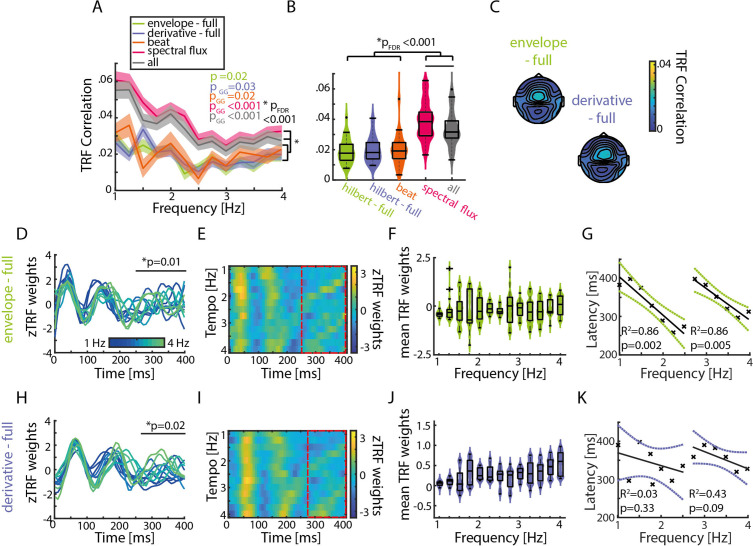
Figure 3—figure supplement 1. TRFs in response to the full-band amplitude envelope and first derivative show similar patterns as the gammatone filtered musical features.

Figure 3—figure supplement 1.

(A) Mean TRF correlations across stimulation tempi and musical features (± SEM). (B) TRF correlations across musical features. Violin plots indicate the median, 25th and 75th percentiles (n=34, repeated-measure ANOVA; *pFDR <0.001). Similarly to the gammatone filtered features, the full-band envelope and derivative show significantly smaller TRF correlations in comparison to the spectral flux and the combination of all features. (C) Auditory topographies of the TRF correlations in response to the full-band features. (D) TRF weights for time lags between 0 and 400ms of the Hilbert envelope. Cluster-based permutation testing was used to identify significant time lag windows (envelope: 250–400ms, p=0.01; derivative: 281–400ms, p=0.02). Each line represents one stimulation tempo (n=13, blue, 1 Hz - green, 4 Hz). (E) Colormaps of the TRF weights over the same time lags for the envelope. Red dashed lines highlight significant time windows. (F) Average TRF weights from the significant time lag window for the envelope (n=34, median, 25th and 75th percentile). (G) Latency of the P3 peak located in the significant time lag window across stimulation tempi for the full-band envelope TRFs. The latencies were divided into two subgroups (1–2.5 Hz and 2.75–4 Hz) and a regression fit into the data. (H)-(K) Same as (D)-(G) for the first derivative.
Figure 3—figure supplement 2. Corrected TRF weights of the spectral flux after removing the effects of the other musical features.
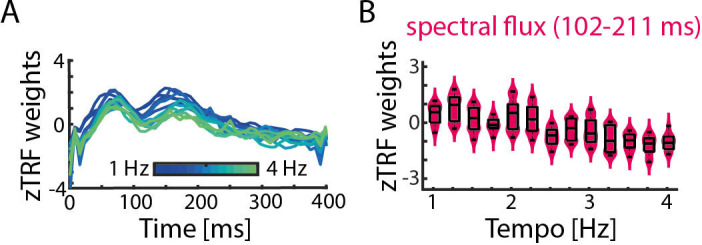
Figure 3—figure supplement 2.

(A) TRF weights in response to the spectral flux. To calculate those weights, a multivariate TRF approach based on the amplitude envelope, first derivative and beat onsets was used and the resulting TRF predictions were subtracted from the ‘actual’ EEG data. The residual EEG data was used to compute the spectral TRF model. (B) Similarly to the main Figure 3F the TRF weights at the previously calculated significant time window were plotted as a function of tempo. The boxplots indicate the median, 25th and 75th percentile (n=34).
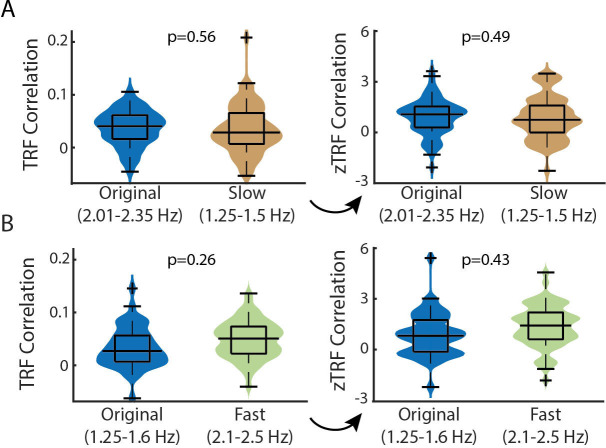
Figure 3—figure supplement 3. No differences in TRFs correlations between more vs. less modulated music.

Figure 3—figure supplement 3.

(A) TRF correlations for up to three trials per participant when the original music tempo ≈ manipulated music tempo (labelled ‘Original’) vs. when the manipulated music tempo was faster than the original music segments (‘Slow’). For this analysis, different trials for the different stimulation subgroups from the same stimulation tempo condition (here: 2.25 Hz) were used (nori = 91; nslow = 96 trials). In the right plot the TRF correlation were z-scored based on the surrogate distribution on a per trials basis. No significant differences were observed between groups (repeated-measures ANOVA). (B) Same as (A), but here the original tempo was at a slower tempo and was contrasted against music segments that were originally faster and were manipulated to be played at a 1.5 Hz (nori = 57; nfast = 58 trials). The boxplots indicate the median, 25th and 75th percentile.