. 2022 Sep 12;11:e75515. doi: 10.7554/eLife.75515

Figure 4. Significant relationships between SRCorr and TRF correlations for all musical features.

(A) Linear-mixed effects models of the SRCorr (predictor variable) and TRF correlations (response variable) in response to the amplitude envelope. Each dot represents the mean correlation of one participant (n=34) at one stimulation tempo (n=13) (=grouping variables; blue, 1 Hz-green, 4 Hz). Violin plots illustrate fixed effects coefficients (β). (B)-(D) same as (A) for the first derivative, beat onsets and spectral flux. For all musical features, the fixed effects were significant.

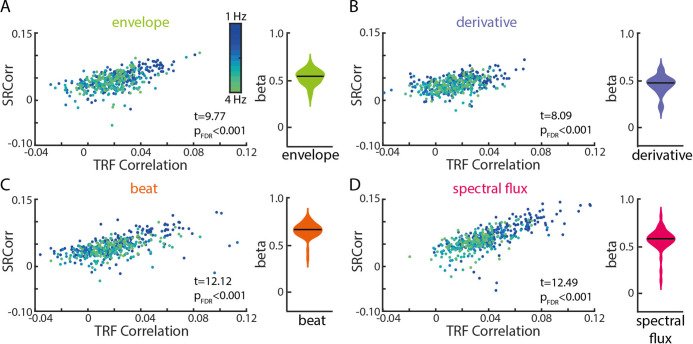
Figure 4—source data 1. Source data for comparing the results of the TRF and RCA-based measures.

Figure 4.

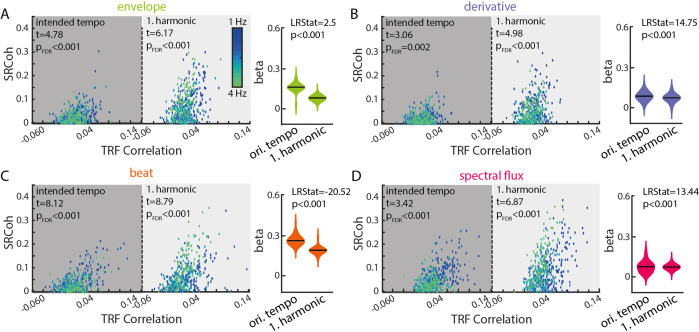
Figure 4—figure supplement 1. Significant relationships between SRCoh and TRF correlations for all musical features at the stimulation tempo and first harmonic.

Figure 4—figure supplement 1.

(A) Linear-mixed effects models of the SRCoh (predictor variable) and TRF correlations (response variable) in response to the amplitude envelope at the intended stimulation tempo (left, dark grey) and first harmonic (right, light grey). Each dot represents the mean correlation of one participant (n=34) at one stimulation tempo (n=13) (=grouping variables; blue, 1 Hz-green, 4 Hz). Violin plots illustrate fixed effects coefficients (β). (B)-(D) same as (A) for the first derivative, beat onsets and spectral flux. For all musical features, the fixed effects were significant (pFDR <0.01). Model comparisons were implemented based in the Likelihood ratio test (LRStat, p<0.001).