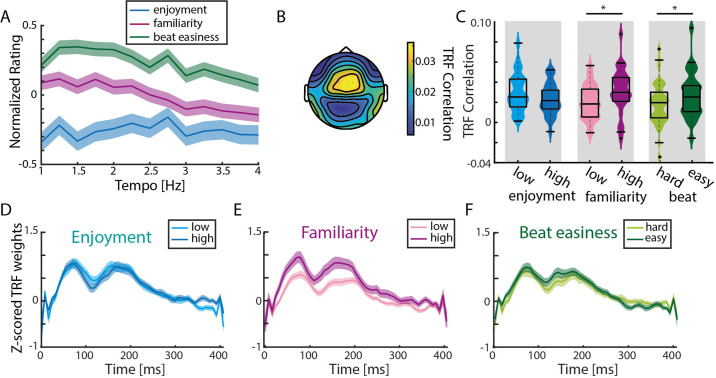
Figure 5. TRF correlations are highest in response to familiar songs.
(A) Normalized (to the maximum value per rating/participant), averaged behavioral ratings of enjoyment, familiarity and easiness to tap to the beat (± SEM). No significant differences across tempo conditions were observed (repeated-measure ANOVA with Greenhouse-Geiser correction). (B) Mean TRF correlations topography across all ratings (based on the analysis of 15 trials with highest and lowest ratings per behavioral measure). (C) Violin plots of TRF correlations comparing low vs. highly enjoyed, low vs. highly familiar, and subjectively difficult vs. easy beat trials. Strongest TRF correlations were found in response to familiar music and music with an easy-to-perceive beat (n=34, paired-sample t-test, *pFDR <0.05). Boxplots indicate median, 25th and 75th percentile. (D) Mean TRFs (± SEM) for time lags between 0–400ms of more and less enjoyable music songs. (E)-(F) Same as (D) for trials with low vs. high familiarity and difficult vs. easy beat ratings.
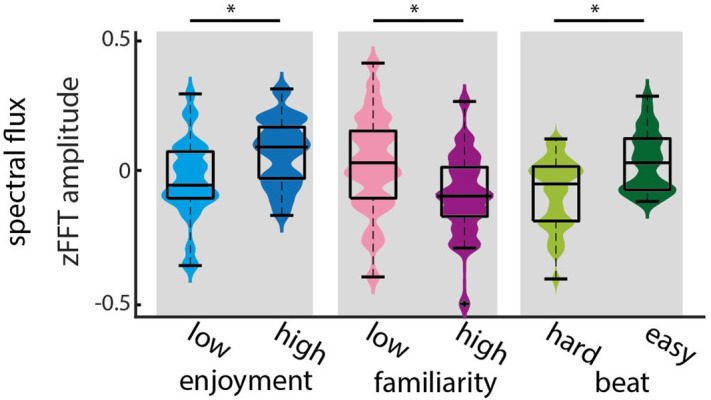
Figure 5—figure supplement 1. Significant differences of FFT amplitudes at stimulus-relevant frequencies between differently rated trials.

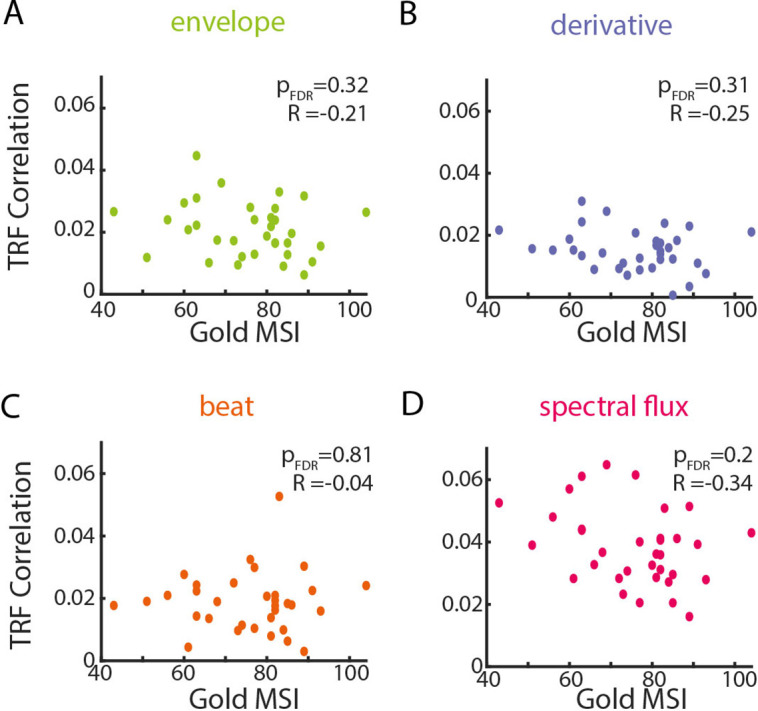
Figure 5—figure supplement 2. Musical training did not have an effect on TRF correlations regardless of the musical feature.


