Figure 2.

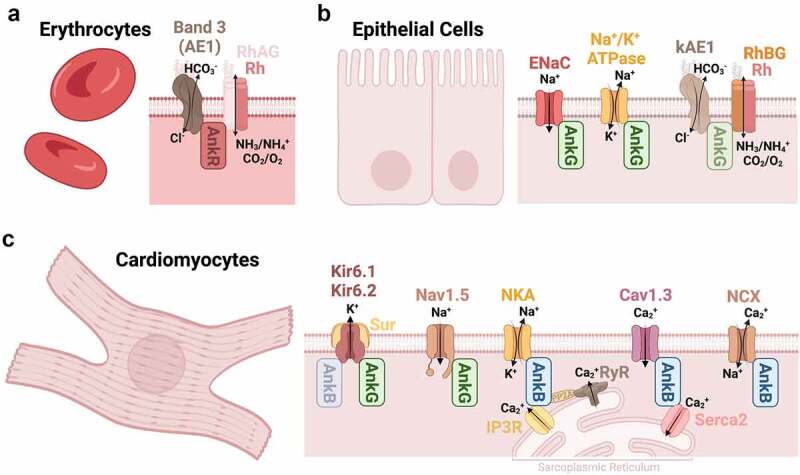
Schematic diagram of ankyrin’s channel and transporter interactions in the periphery [106]. These include, (a) AnkR in erythrocytes, (b) AnkG in epithelial cells, and (c) AnkB and AnkG in cardiomyocytes.

Schematic diagram of ankyrin’s channel and transporter interactions in the periphery [106]. These include, (a) AnkR in erythrocytes, (b) AnkG in epithelial cells, and (c) AnkB and AnkG in cardiomyocytes.