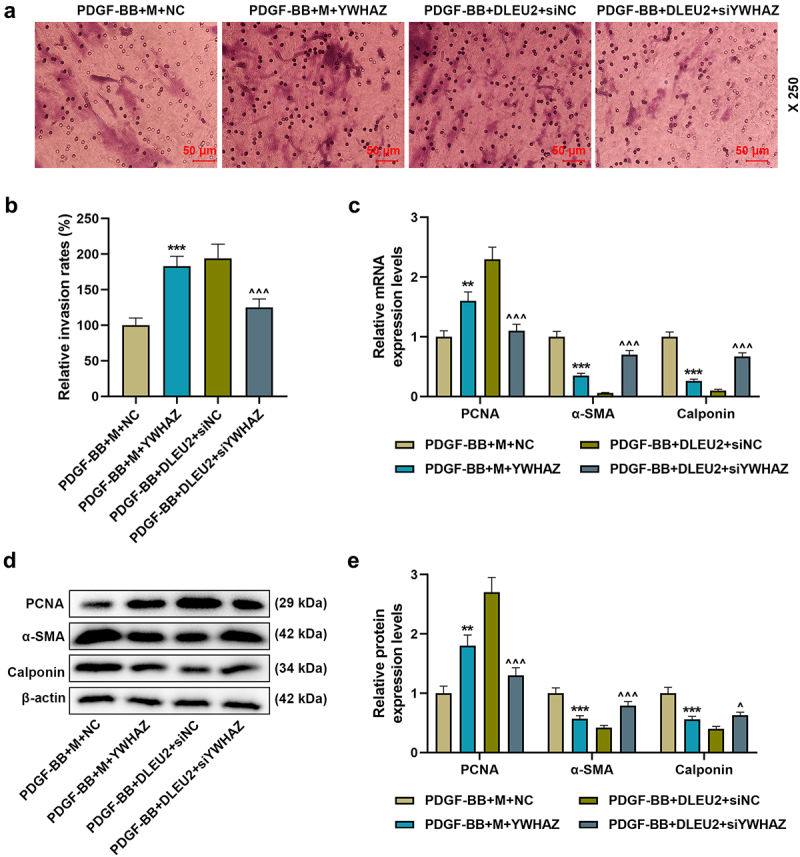
Figure 7.

DLEU2 affected PDGF-BB-induced VSMC migration and the expressions of PCNA, α-SMA and Calponin through miR-212-5p/YWHAZ axis. (a-b) The invasion rate of cells in PDGF-BB+M+ NC, PDGF-BB+M+ YWHAZ, PDGF-BB+DLEU2+ siNC, and PDGF-BB+DLEU2+ siYWHAZ groups was assessed by Transwell assay. (c-e) The expressions of PCNA, α-SMA and Calponin were analyzed by RT-qPCR and Western blot. β-actin was used as a control. **P < 0.01, ***P < 0.001 vs. PDGF-BB+M+ NC; ^P < 0.05, ^^^P < 0.001 vs. PDGF-BB+DLEU2+ siNC. All experiments were repeated at least three times. Data were expressed as mean ± standard deviation. Data among multiple groups were analyzed by one-way ANOVA, followed by Tukey’s post hoc test.
