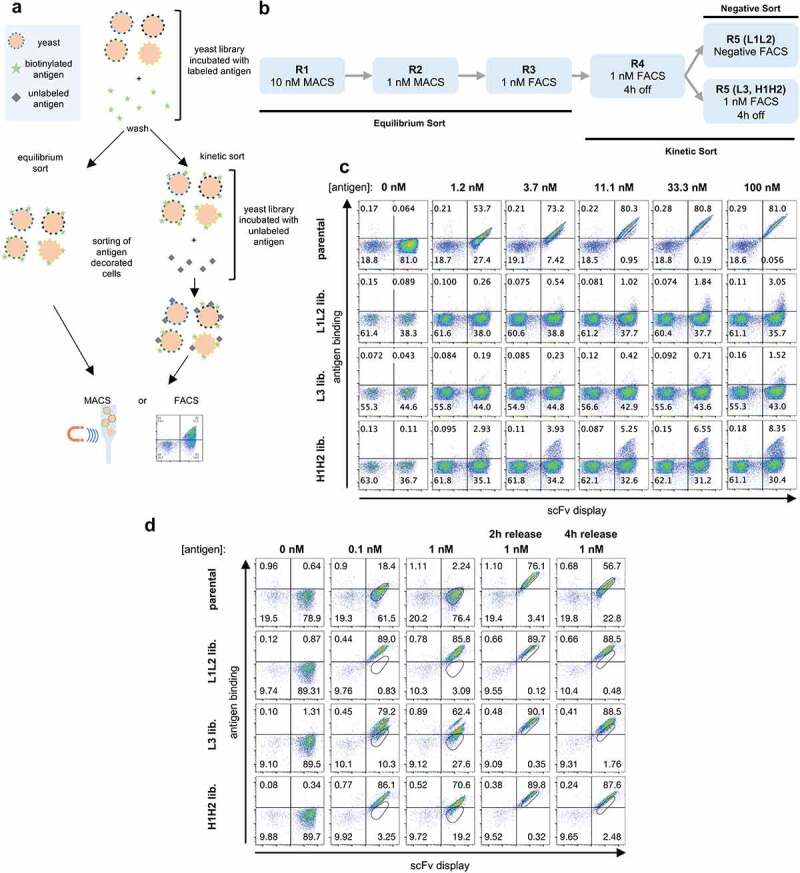
Figure 2.

(a) Schematic representation of yeast display selections using equilibrium and kinetic protocols. (b) Outline of the selection rounds performed in phase 1 with the three-phase 1 libraries (L1L2, L3, and H1H2). (c) The yeast display binding profiles of the parental scFv and the three starting phase 1 libraries at increasing antigen concentration assessed by flow cytometry. Binding to antigen (APC fluorescence) is shown on the Y-axis and scFv display (PE fluorescence) is shown on the X-axis. (d) Yeast display binding profile of the parental scFv and the three-phase 1 libraries after 5 rounds of selection. A reference gate representing the parental population at the corresponding given concentration is shown. In the last two columns, after labeled antigen incubation, cells were washed and incubated with an excess of unlabeled antigen for 2 h and 4 h to evaluate overall improvement in off-rates.
