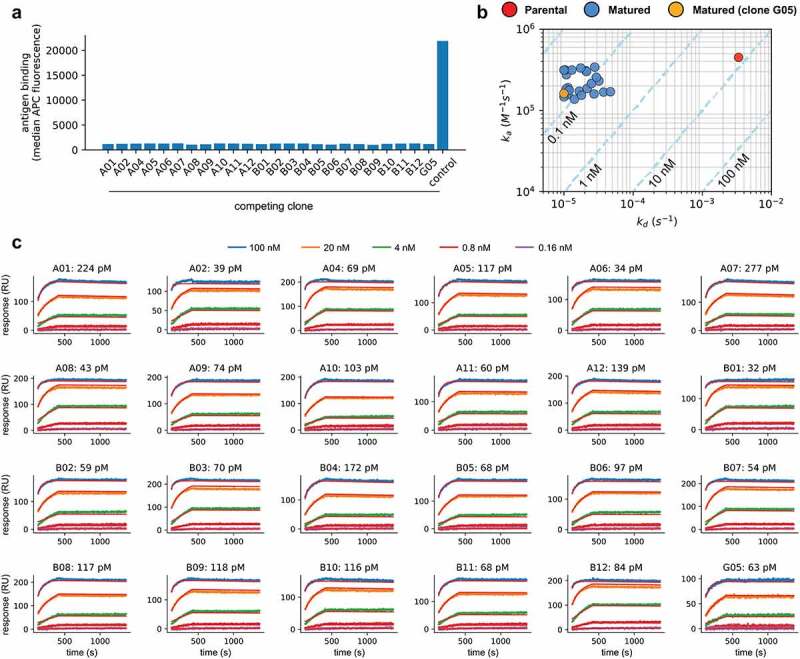
Figure 5.

(a) Antigen binding to yeast displaying the parental scFv when competing with 24 affinity-matured clones (A01-A02, A04-A12, B01-B12, G05) and an unrelated scFv-Fc (control). Binding values are given by the median APC fluorescence of the yeast displaying population. There is no binding to the target by the parental clone whenever the antigen is pre-blocked with one of the selected clones, but binding is retained when the antigen is pre-incubated with a control clone. (b) Observed on-rates (ka) and off-rates (kd) for the parental and 24 affinity-matured clones (clone G05, which does not have the LCDR2 liabilities is highlighted in Orange). Reported values are the mean of at least 4 measurements. Isoaffinity curves (KD) are shown as dashed diagonal lines. (c) SPR sensorgrams for 24 affinity-matured clones. The name of the clones and calculated KD are shown in each plot.
