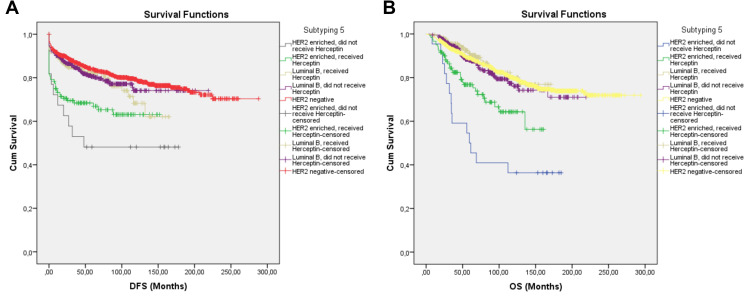
Figure 6.
Survival curves of DFS (A) and OS (B) for the HER2-negative, Luminal B subgroup receiving Herceptin, the Luminal B subgroup that did not receive Herceptin, the HER2-enriched subgroup that received Herceptin, and the HER2-enriched subgroup that did not receive Herceptin, producing subtype 5 using the Kaplan–Meier method.

