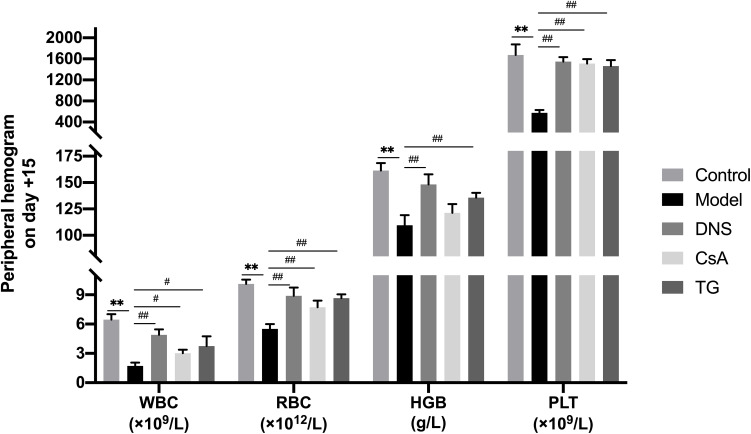
Figure 3.
Comparison of peripheral hemograms among groups on day +15.
Notes: Routine blood tests were examined by automatic blood cell differential counter at 15 days after the establishment of model. Data are shown as mean ± SD (n = 4), **P < 0.01 (as compared with Control); #P < 0.05, ##P < 0.01 (as compared with Model).
Abbreviations: Control, group control; Model, group model; DNS, Dioscorea nipponica saponins-treated group; CsA, cyclosporin A-treated group; TG, ripterygium glycosides-treated group; WBC, white blood cells; RBC, red blood cells; HGB, hemoglobin; PLT, platelets.

