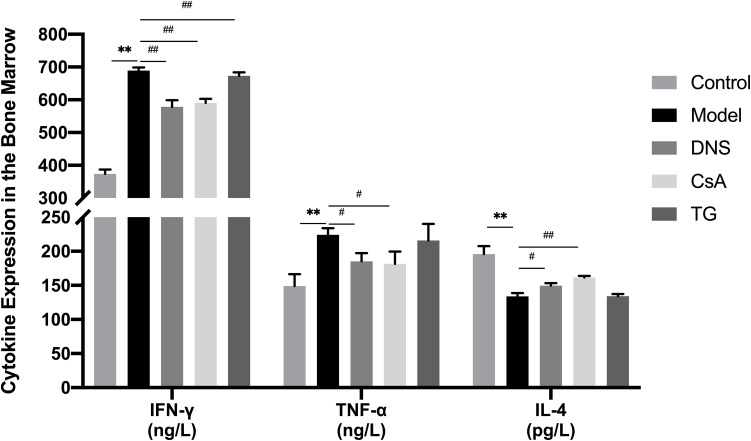
Figure 8.
The expression levels of cytokines in the bone marrow cavity of different groups.
Notes: Expression levels of cytokines TNF-α, IFN-γ and IL-4 in bone marrow cavity were detected by ELISA. Data are shown as mean ± SD (n = 4),**P<0.01 (as compared with Control); #P<0.05, ##P<0.01 (as compared with Model).
Abbreviations: Control, group control; Model, group model; DNS, Dioscorea nipponica saponins-treated group; CsA, cyclosporin A-treated group; TG, tripterygium glycosides-treated group.

