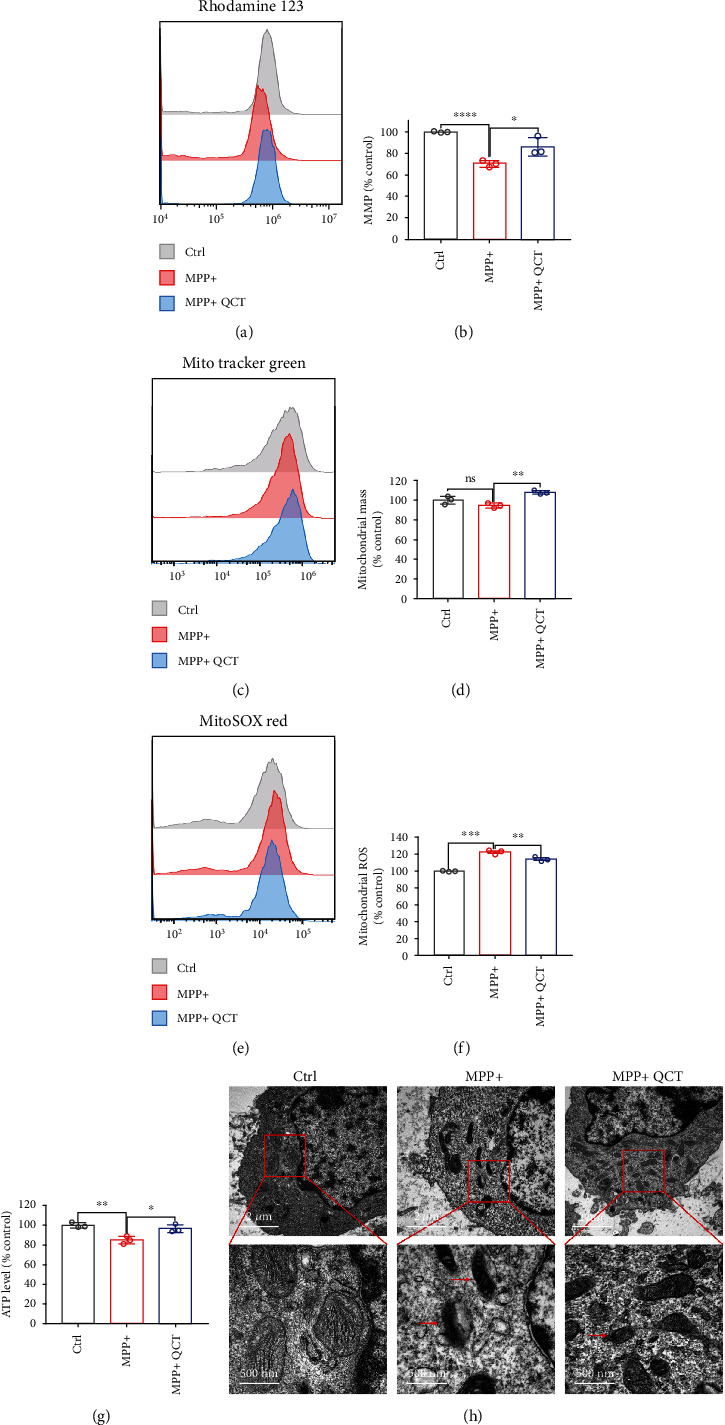
Figure 4.

QCT alleviated mitochondrial dysfunction in MPP+-treated PC12 cells. (a, b) Mitochondrial membrane potential was assayed by flow cytometry using Rhodamine 123 (n = 3). (c, d) Mitochondrial mass was assayed by flow cytometry using MitoTracker Green (n = 3). (e, f) Mitochondrial ROS was assayed by flow cytometry using MitoSOX Red (n = 3). (G) Intracellular ATP levels in PC12 cells treated with or without QCT (10 μM, 1 h), followed by MPP+ (0.5 mM, 24 h) treatment, were assayed by the ATP Assay Kit (n = 3). (h) Representative transmission electron microscopy images for PC12 cells treated with or without QCT (10 μM, 1 h), followed by MPP+(0.5 mM, 24 h) treatment. Red arrows indicate shrunken mitochondria. Scale bars as indicated. Data are presented as the mean ± SEM. One-way ANOVA followed by Tukey's post hoc test. ∗p < 0.05, ∗∗p < 0.01, and ∗∗∗p < 0.001.
