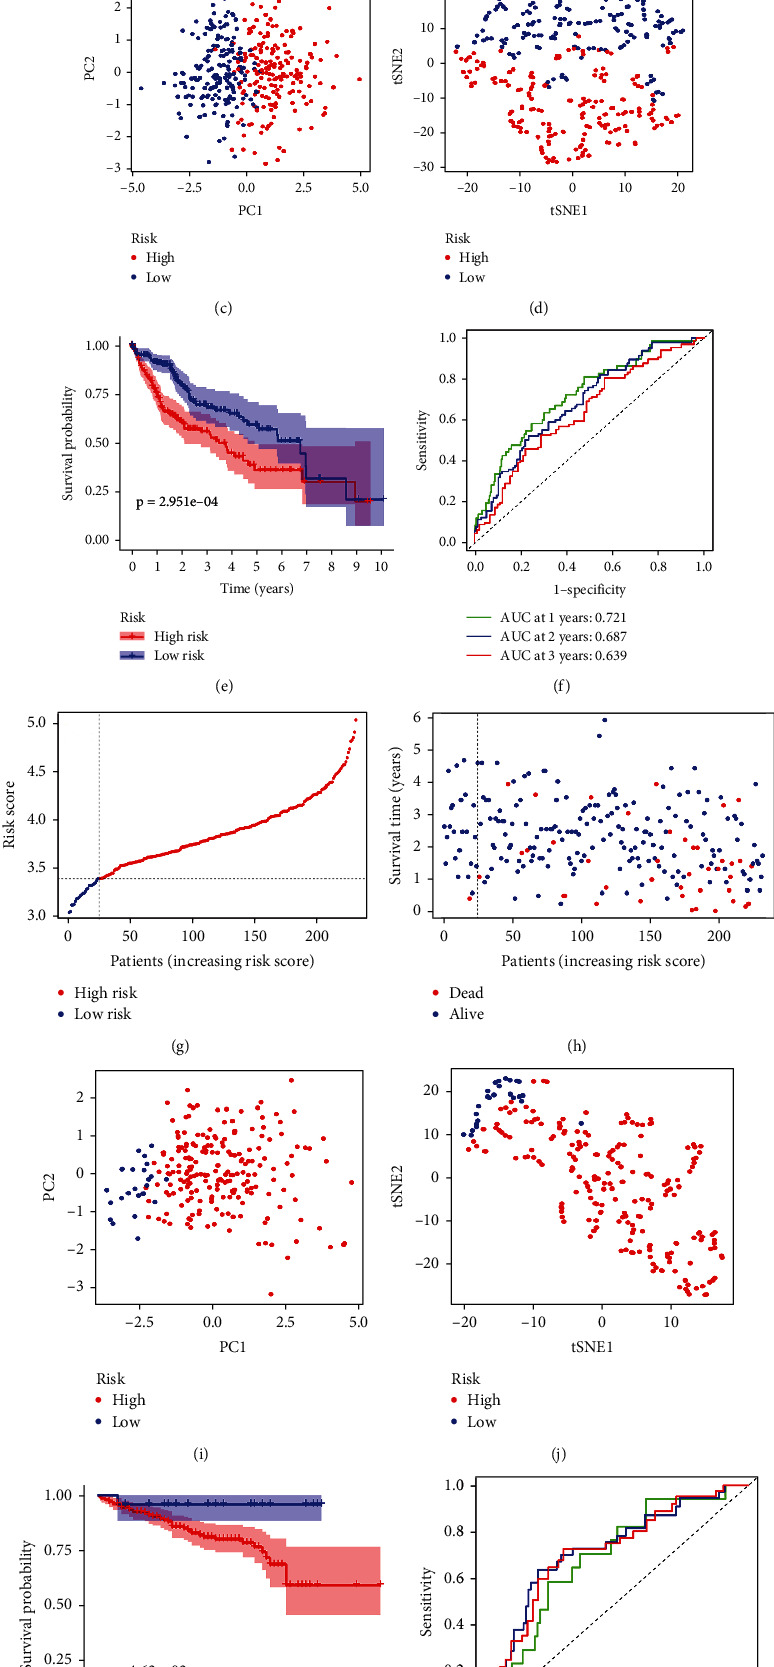
Figure 2.

Prognosis analysis of the prognostic model in TCGA and ICGC cohorts. The distribution and median value of the risk score in the TCGA cohort (a) and the ICGC cohort (g). The distributions of survival status and risk scores in the TCGA cohort (b) and the ICGC cohort (h). PCA plot of the TCGA cohort (c) and the ICGC cohort (i). t-SNE analysis of the TCGA cohort (d) and the ICGC cohort (j). The Kaplan–Meier curves of the TCGA cohort (e) and the ICGC cohort (k). The AUC of time-dependent ROC curves used to predict the OS of patients from the TCGA cohort (f) and the ICGC cohort (l).
