Figure 5.

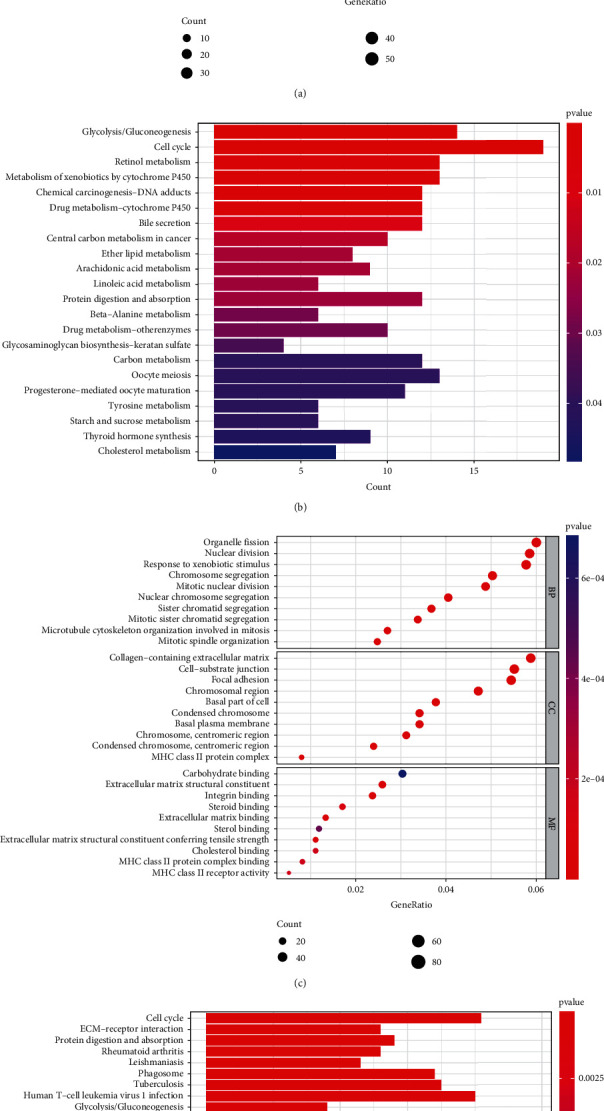
Representative outcomes of GO and KEGG enrichment analyses of the DEGs between the low-risk and high-risk groups. The most significant GO and KEGG enrichment in the TCGA cohort (a, b) and the ICGC cohort (c, d).

Representative outcomes of GO and KEGG enrichment analyses of the DEGs between the low-risk and high-risk groups. The most significant GO and KEGG enrichment in the TCGA cohort (a, b) and the ICGC cohort (c, d).