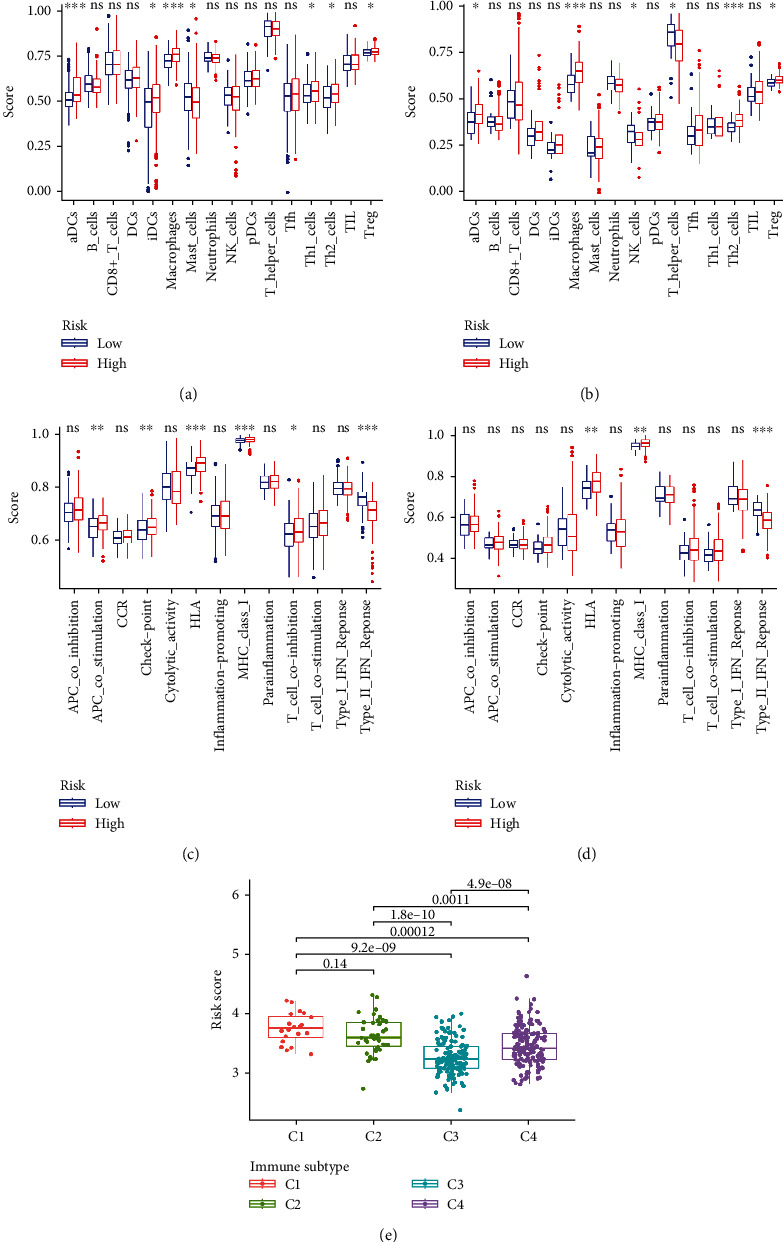
Figure 6.

The immune status and infiltration subtypes between different risk groups. The boxplots for scores of sixteen immune cell subpopulations of the low-risk and high-risk groups in the TCGA cohort (a) and the ICGC cohort (b). The boxplots for thirteen immune-associated functions of the low-risk and high-risk groups in the TCGA cohort (c) and the ICGC cohort (d). Correlations between risk score and immune infiltration subtypes (e). The P value is presented as: ∗P < 0.05; ∗∗P < 0.01; ∗∗∗P < 0.001; ns indicates “not significant”.
