Figure 7.

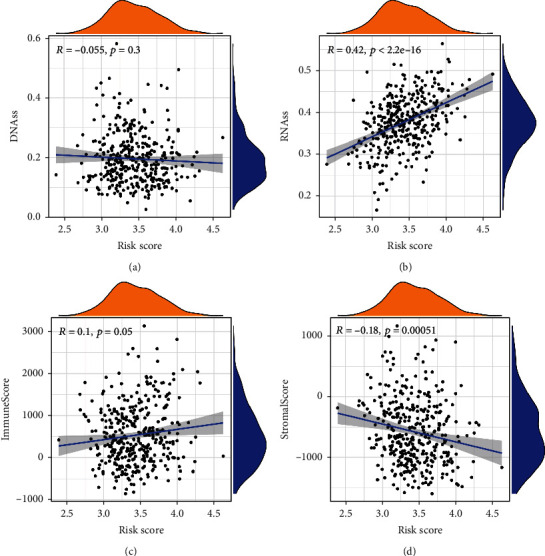
The correlation between the risk score and tumor microenvironment in the TCGA cohort. The correlation between the risk score and DNAss (a), RNAss (b), immune score (c), and stromal score (d).

The correlation between the risk score and tumor microenvironment in the TCGA cohort. The correlation between the risk score and DNAss (a), RNAss (b), immune score (c), and stromal score (d).