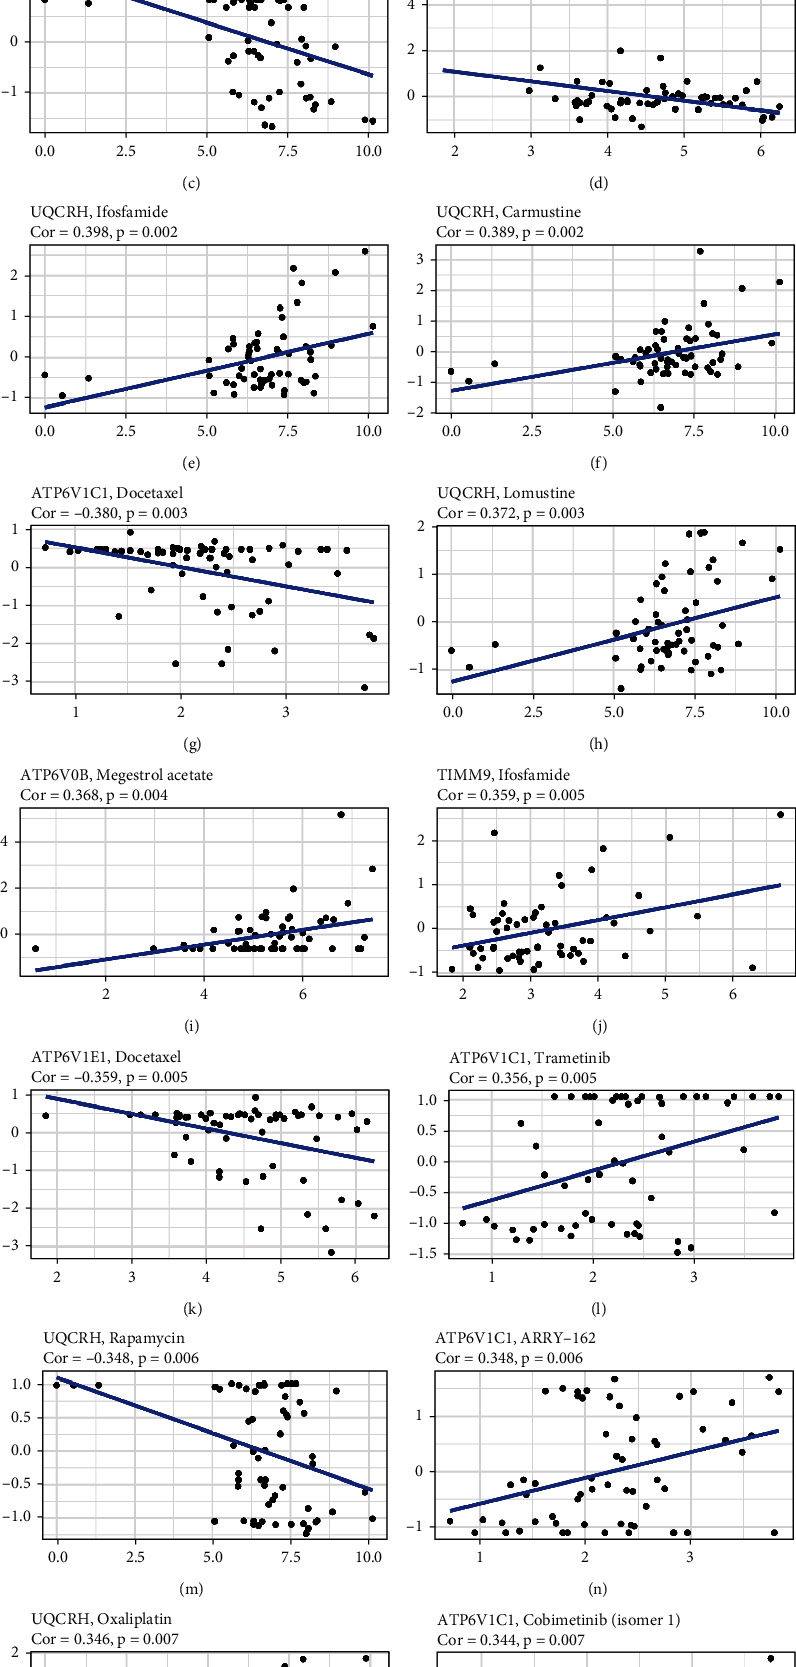
Figure 8.

Scatter plots of the top sixteen kinds of associations between the five genes of the prognostic model and chemotherapy drug sensitivity.

Scatter plots of the top sixteen kinds of associations between the five genes of the prognostic model and chemotherapy drug sensitivity.