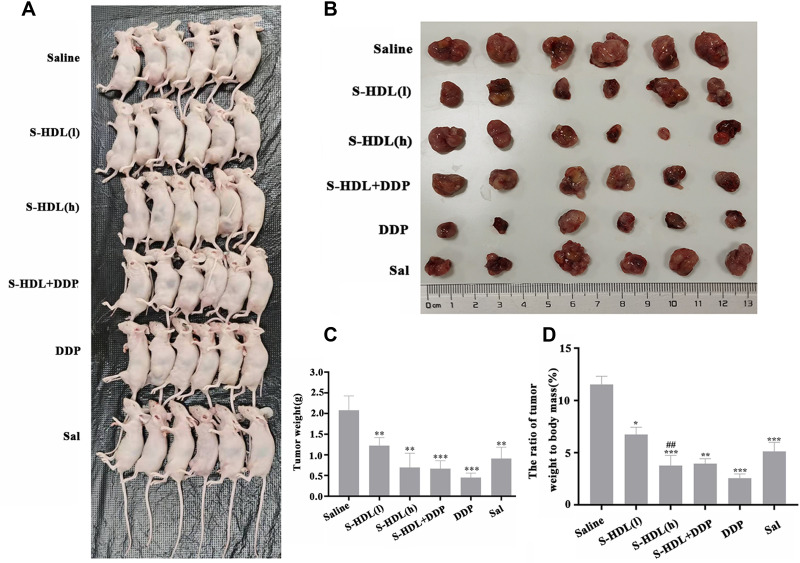
Figure 5.
Inhibitory effects of S-HDL on ovarian cancer xenografted mice. (A) Overall tumor formation in nude mice. (B) Tumor in xenografted mice after being treated with Saline, S-HDL (l) (200μg/kg S-HDL), S-HDL (h) (400μg/kg S-HDL), S-HDL+DDP (200μg/kg S-HDL combined with 1mg/kg cisplatin), DDP (2mg/kg cisplatin), and Sal (400μg/kg Sal) for 3 weeks. (C) Tumor weight of different groups. (D) The ratio of tumor weight to body mass ( , n=6) (*P < 0.05, **P < 0.01, ***P < 0.001, *compared with Saline treatment group; ##P < 0.01, #compared with Sal treatment group).

