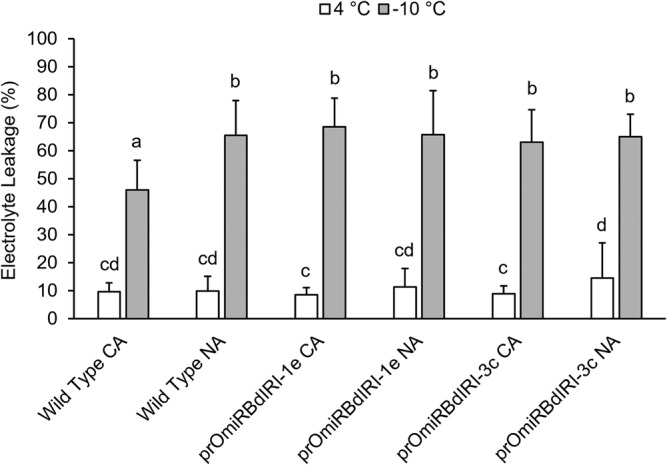
FIGURE 4.

Electrolyte leakage assays performed on non‐acclimated (NA) and cold‐acclimated (CA) wild type Brachypodium distachyon Bd21 and two homozygous temporal antifreeze protein knockdown lines (prOmiRBdIRI‐1e and prOmiRBdIRI‐3c). Control leaves were maintained at 4°C (white bars), whereas experimental samples were incubated at −10°C (gray bars) as indicated. Electrolyte leakage was measured as a percentage of electrolytes released after the freeze protocol as a ratio of the total released electrolytes after autoclaving, based on the total leaf mass in the sample (see Section 2). Letters represent statistically significant groups following one‐way analysis of variance (ANOVA) with post‐hoc Tukey multiple test correction (p < .05). Error bars represent the standard deviation of the mean, and assays were performed in triplicate (n = 10).
