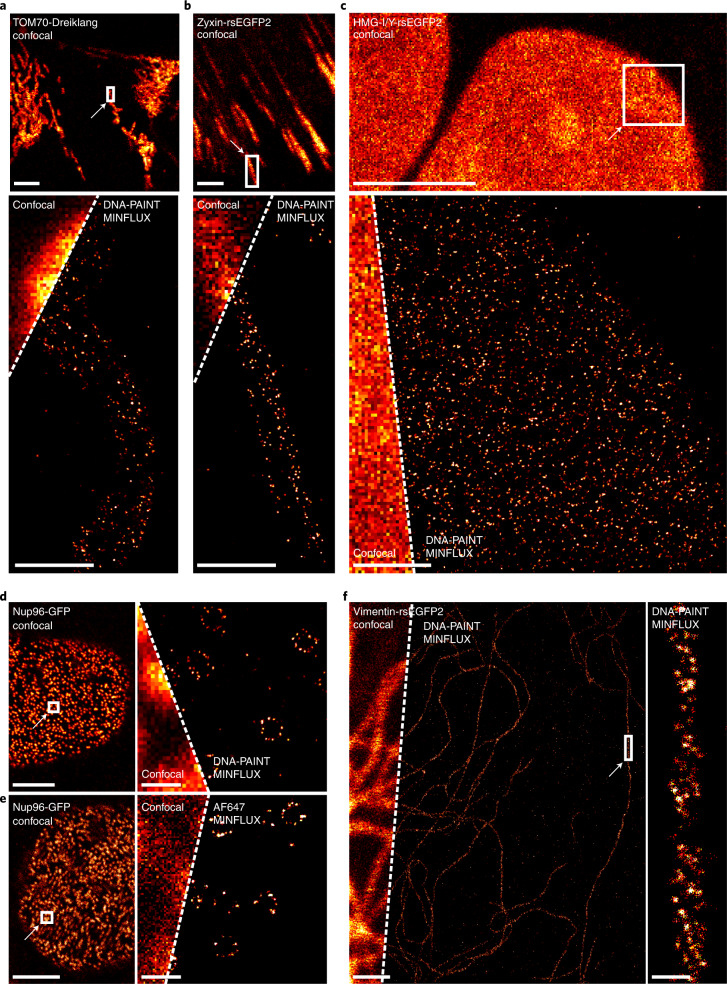
Fig. 1. 2D DNA-PAINT MINFLUX imaging.
a–f, Genome-edited cell lines expressing translational fusions with a fluorescent protein from the respective native genomic loci, as indicated (TOM70-Dreiklang (a), Zyxin-rsEGFP2 (b), HMG-I/Y-rsEGFP2 (c), Nup96-GFP (d, e), Vimentin-rsEGFP2 (f)), were labeled with an anti-GFP nanobody coupled to a docking strand and mounted with the imager strand (a–d,f), or with an anti-GFP nanobody coupled to Alexa Fluor 647 and mounted in STORM imaging buffer (e). Confocal overview images of the fluorescent protein fluorescence were taken. The rectangles indicate areas of MINFLUX recordings. For imager strand concentrations and localization precisions, see Supplementary Table 1. All Scale bars (confocal images): 5 µm (a–e), 1 µm (f). Scale bars (MINFLUX) 0.5 µm (a–c), 1 µm (f), 200 nm (d,e). Scale bar (MINFLUX close-up), 50 nm (f).

