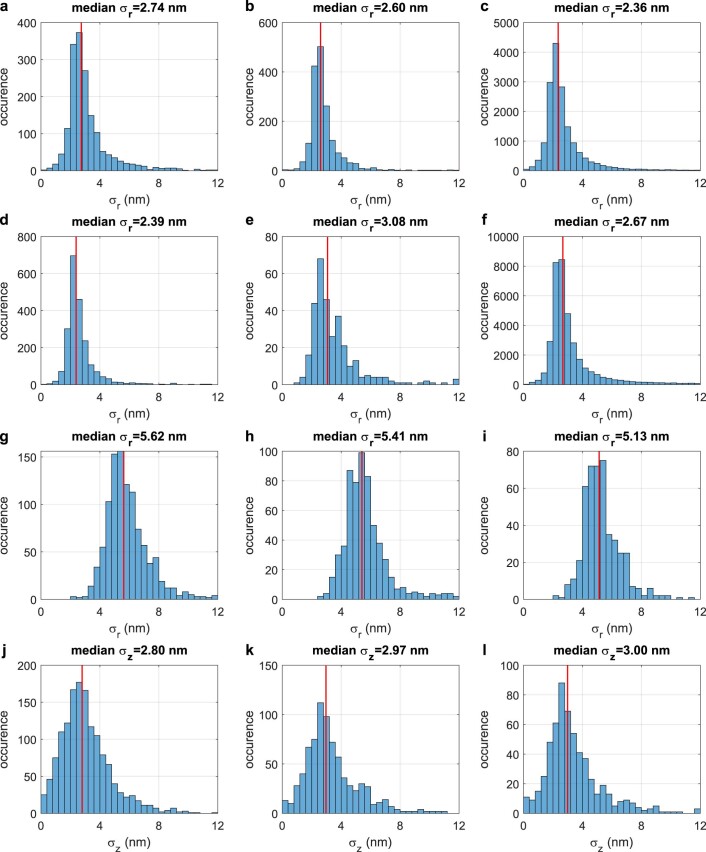
Extended Data Fig. 2. Histograms of the localization precisions in Fig. 1 and Fig. 2.
Blue columns represent the frequencies of localization precisions in the given dataset (a: Fig. 1a; b: Fig. 1b; c: Fig. 1c; d: Fig. 1d; e: Fig. 1e; f: Fig. 1f; g: Fig. 2 TOM70 σr; h: Fig. 2 Mic60 σr; i: Fig. 2 ATP5B σr; j: Fig. 2 TOM70 σz; k: Fig. 2 Mic60 σz; l: Fig. 2 ATP5B σz). The red line represents the median of the localization precisions in the dataset.

