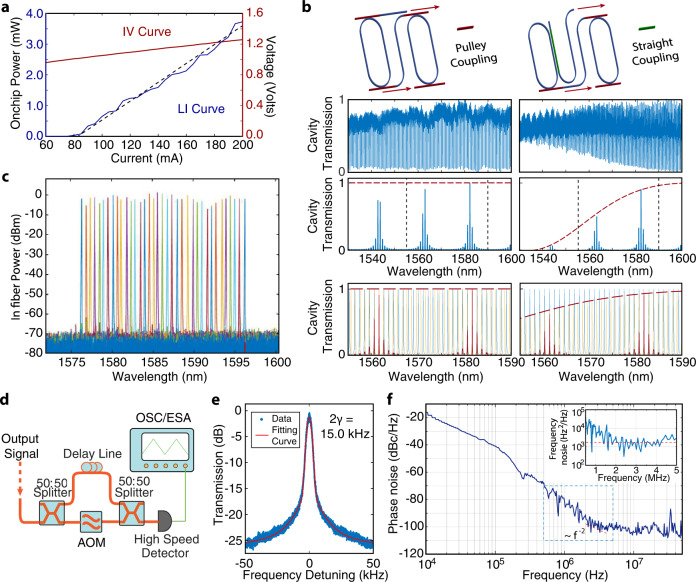
Fig. 2. Power, linewidth, and wavelength tuning characteristics of the laser.
a Measured LI and IV curves of the laser. b Schematic of the Vernier ring structure: the left one with pulley coupling and the right one with straight coupling replacing the output pulley bus waveguide. Second row: Measured transmission spectrum of both pulley and straight coupling. Third row: Simulated transmission spectrum of the Vernier structure output. Left: with pulley coupling applied to all ports. Right: with output port replaced by straight coupling. Red dashed lines show the power transfer limited by the coupling rate. c Thermal-optic tuning spectrum of the laser wavelength recorded by an optical spectrum analyzer. d Setup schematic of delayed self-heterodyne phase noise measurement. AOM: acoustic-optical modulator. OSC: real-time oscilloscope. ESA: electrical signal analyzer. e Noise spectrum of laser measured by sub-coherence delayed self-heterodyne measurement. The curve is fit by a combination of Lorentzian and Gaussian distribution. γ is the half width of the half maximum of Lorentzian distribution. f Noise spectra of laser measured by correlated delayed self-heterodyne measurement. The dark blue line is the phase noise signal measured by a real-time oscilloscope. The light blue line in the inset shows the frequency noise signal derived from the phase noise. A white noise floor is highlighted by the dashed red line correspondingly in both plots. The dashed rectangular box indicates the frequency range corresponding to the inset figure.

