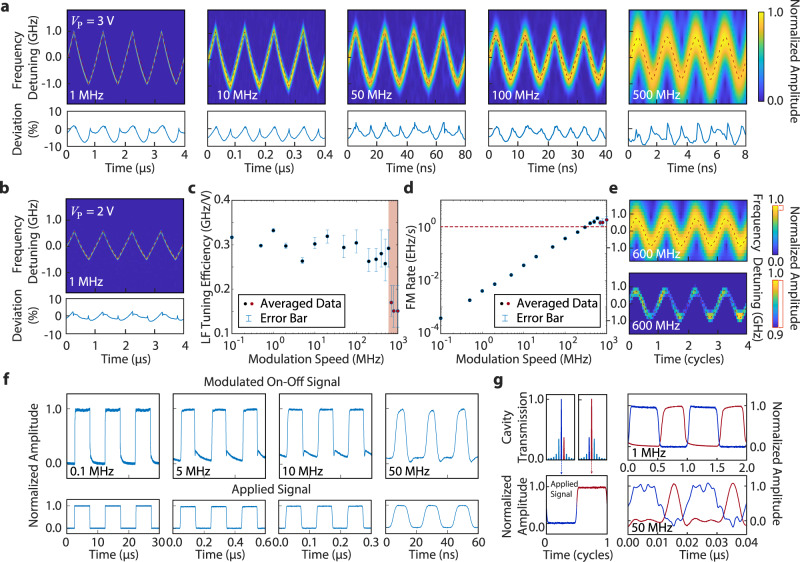
Fig. 3. High-speed tuning and switching characteristics of the laser.
a Time-frequency spectrograms of the beat note between the Pockels laser and a reference diode laser, at different modulation frequencies. The red dashed lines show the triangular waveforms of the driving electrical signal (with an amplitude of VP = 3 V) (The slight waveform distortion is induced by the limited bandwidth of a RF amplifier used to boost the electrical signal. See Methods for details). The lower panel shows the deviation of signal compared to the modulating triangular ramp. b Time-frequency spectrogram of the beat note with a smaller driving voltage of VP = 2 V. c The recorded laser-frequency (LF) tuning efficiency of the laser frequency. The red shaded area indicates the frequency range beyond the photon lifetime limit of the laser cavity. The error bars indicate the processing uncertainty of STFT at high frequency caused by the measurement setup limitation. d Recorded laser frequency modulation rate. Red dashed line highlights the level of 1 EHz/s. e Time-frequency spectrogram of the beat note signal with a modulation frequency of 600 MHz and a driving voltage of VP = 3 V. The lower one shows the same spectrogram but with a zoom-in amplitude range of 90–100%. f On-off intensity switching waveform of the laser (top row) at different modulation frequencies. The corresponding driving electrical signal is shown in the bottom row, with an amplitude of VP = 3 V. g Left: Schematic shows the switching between adjacent Vernier lasing mode in red and dark blue curve with the applied electrical signal shown on the bottom. Right: Recorded waveforms of the two lasing modes, at a modulation frequency of 1 MHz and 50 MHz.

