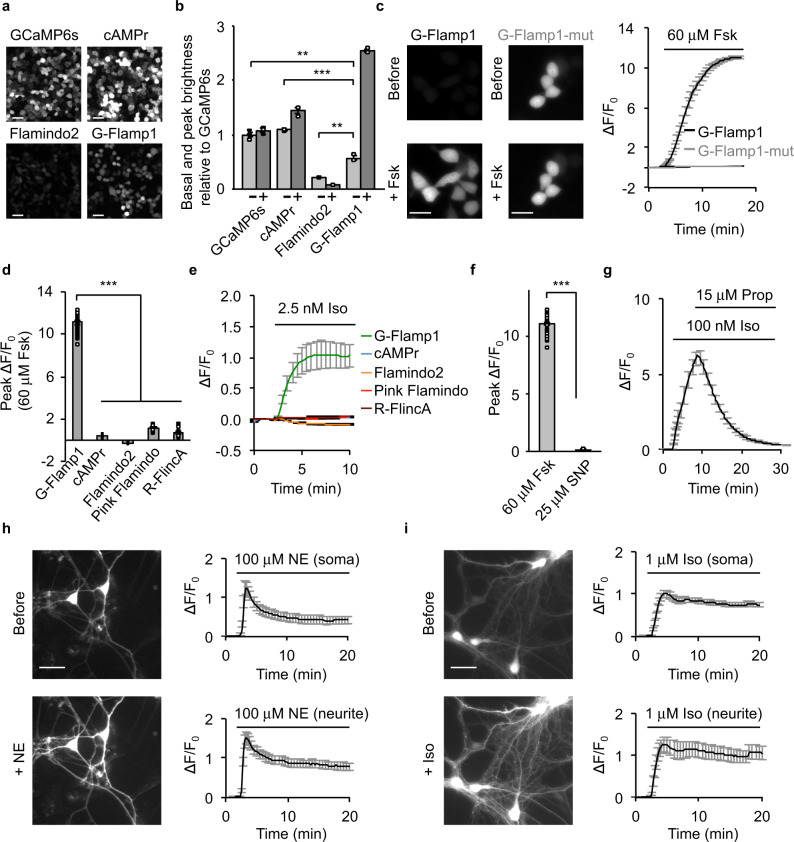
Fig. 2. Characterization of G-Flamp1 in mammalian cells.
a Representative fluorescence images of the sensors in resting HEK293T cells from three independent experiments. Scale bars: 50 μm. b Basal and peak brightness of the sensors in HEK293T cells (excited at 488 nm). n = 3 cultures for each indicator. P = 0.0033, 8.6 × 10⁻⁴ and 0.0069 between G-Flamp1 and GCaMP6s, cAMPr and Flamindo2, respectively. The minus and plus signs denote without and with 15 min Forskolin (Fsk) treatment, respectively. c Representative fluorescence images (left) and traces of ΔF/F0 (right) excited at 450 nm in response to 60 μM Fsk in HEK293T cells. n = 34 (G-Flamp1) and 22 (G-Flamp1-mut) cells from 3 independent experiments. Scale bars: 20 μm. d Peak ΔF/F0 in HEK293T cells. n = 34 (G-Flamp1), 33 (cAMPr), 42 (Flamindo2), 34 (Pink Flamindo) and 18 (R-FlincA) cells from 3 independent experiments. P = 3.5 × 10−38, 2.8 × 10−38, 1.4 × 10−41, and 1.6 × 10−46 between G-Flamp1 and cAMPr, Flamindo2, Pink Flamindo and R-FlincA, respectively. e Representative traces of ΔF/F0 in response to 2.5 nM Iso in HEK293T cells. n = 30 (G-Flamp1), 28 (cAMPr), 27 (Flamindo2), 27 (Pink Flamindo) and 14 (R-FlincA) cells from three independent experiments. f Peak ΔF/F0 of G-Flamp1 in response to 60 μM Fsk or 25 μM SNP in HEK293T cells. n = 34 (Fsk) and 15 (SNP) cells from three independent experiments. P = 4.3 × 10−38. g Representative traces of ΔF/F0 in response to 100 nM Iso followed by 15 μM Prop in HEK293T cells. n = 17 cells from 3 cultures. Representative fluorescence images (left) and traces of ΔF/F0 in response to 100 μM NE (h) or 1 μM Iso (i) in cortical neurons. n = 10 (soma) and 9 (neurite) regions of interest (ROIs) of 10 neurons from 3 cultures in h and n = 28 (soma) and 14 (neurite) ROIs of 28 neurons from 3 cultures in i. Scale bars: 20 μm.Data are presented as mean ± SEM in b, c (right), d–h (right) and i (right). Two-tailed Student’s t-tests were performed for above statistical analysis. ***P < 0.001 and **P < 0.05. Source data are provided as a Source Data file.

