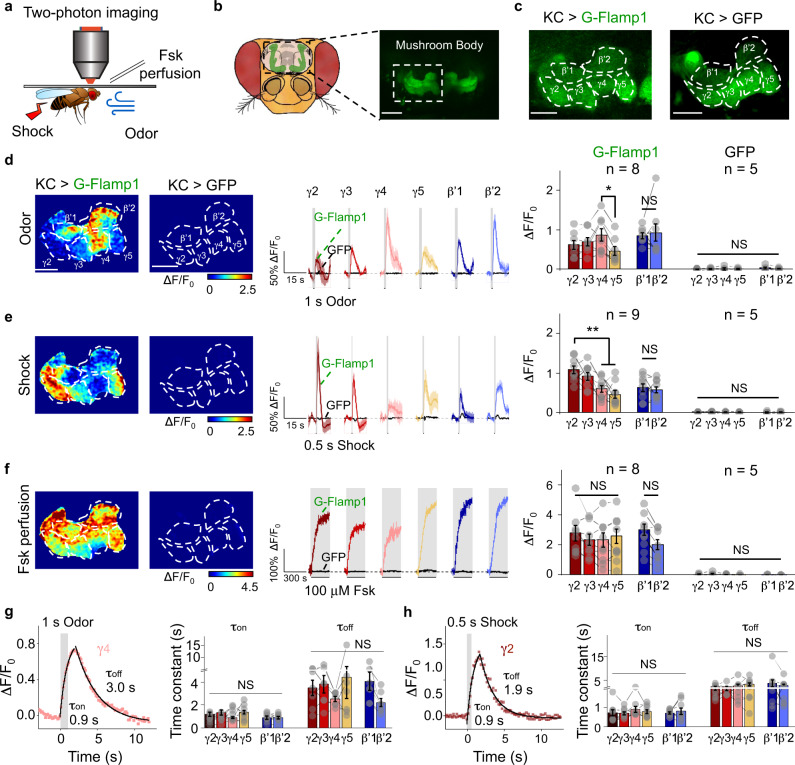
Fig. 3. G-Flamp1 reports compartmental cAMP dynamics evoked by physiological stimuli in Drosophila through in vivo two-photon imaging.
a Schematics of in vivo two-photon imaging setup in Drosophila with multiple stimuli. b Schematics and fluorescent images of Drosophila MB KCs. Scale bar: 50 μm. c Representative fluorescence images of Drosophila MB KCs expressing G-Flamp1 (left) or GFP (right) from 25 or 5 independent experiments. Scale bars: 25 μm. d Representative pseudo-color image (left), traces (center) and quantification (right) of ΔF/F0 to 1 s odor. Representative traces were 3-trial average from one fly. n = 8 and 5 for G-Flamp1 and GFP groups, respectively. Two-tailed Student’s t-tests were performed in d3. P = 0.21, 0.37 and 0.048 between γ4 and γ2, γ3 and γ5, respectively. Scale bars: 25 μm. e Similar to d except that 0.5 s electrical shock was applied to the fly. n = 9 and 5 for G-Flamp1 and GFP groups, respectively. Two-tailed Student’s t-tests were performed in e3. P = 0.368, 0.007 and 0.001 between γ2 and γ3, γ4 and γ5, respectively. f Similar to d except that 100 μM Fsk was perfused to the fly brain. n = 8 and 5 for G-Flamp1 and GFP groups, respectively. Two-tailed Student’s t-tests were performed in f3. P > 0.05 between γ2, γ3, γ4 and γ5. g Representative traces of ΔF/F0 of G-Flamp1 in γ4 evoked by 1 s odor. Data were fitted with single-exponential functions (left). Quantifications of τon and τoff for different MB compartments were shown (right). n = 8 for each compartment. One-way ANOVA test was performed. NS not significant. h Similar to g except that 0.5 s electrical shock was applied to the fly. n = 9 for each compartment. One-way ANOVA test was performed. NS, not significant.Quantifications in d–g (right) and h (right) are shown as mean ± SEM. **P < 0.01, *P < 0.05 and NS not significant.Source data are provided as a Source Data file.

