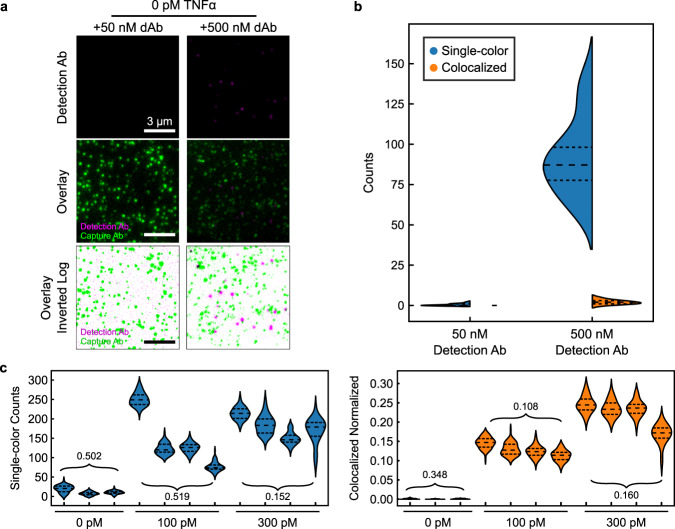
Fig. 2. Colocalization minimizes background from excess detection antibody.
a Single-color fluorescence images of dAb only (top), two-color images of cAb and dAb (middle), and log-scale inverted composite images of two-color detection (bottom) in the absence of TNF-α and with 50 nM (left) or 500 nM (right) dAb. Dark spots in the bottom panels represent colocalized signal from the two fluorophores. b Distributions of absolute single-color and colocalized counts across 16 fields of view (FOVs). Dashed lines demarcate quartiles of the distribution. c Absolute number of dAbs per fields of view (left) and normalized, colocalized counts (right) across different coverslips and TNF-α concentrations. Each violin represents 16 FOVs of a coverslip. Numbers are the coefficients of variance (CV) of the mean FOV counts across coverslips.

