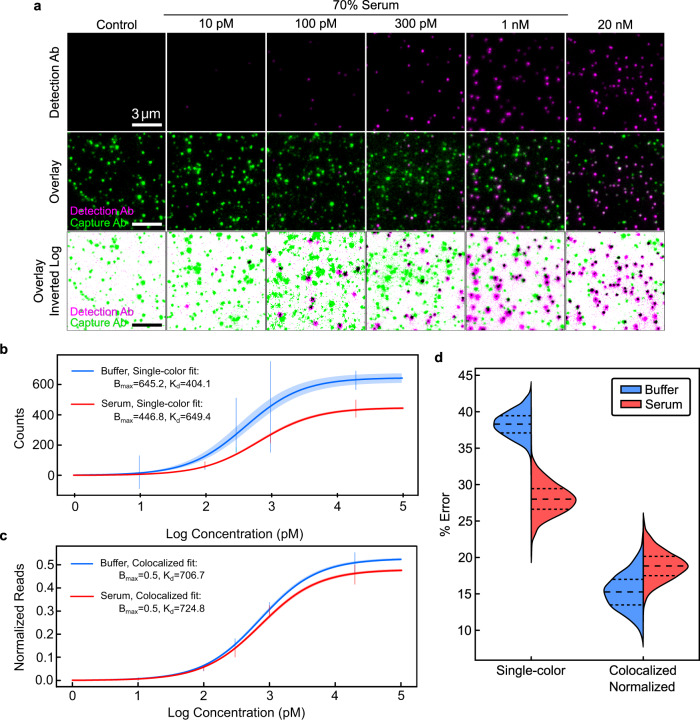
Fig. 3. Quantification of TNF-α via single- and two-color analysis in buffer and 70% chicken serum.
a Single-color (top) and colocalized (middle, bottom) signal for increasing concentrations of TNF-α spiked into 70% chicken serum with 50 nM dAb. Best-fit TNF-α binding curves for (b) absolute dAb counts and (c) normalized, colocalized counts in buffer and 70% chicken serum. 2σ confidence curves are shaded. Summary of primary data represented as vertical bars spanning 1σ from mean. For primary data, please see Supplementary Fig. 9. d Bootstrapped mean absolute percent error in TNF-α quantification for buffer and serum for absolute versus normalized, colocalized dAb counts. All distributions are from 128 FOVs collected from two coverslips per condition.

