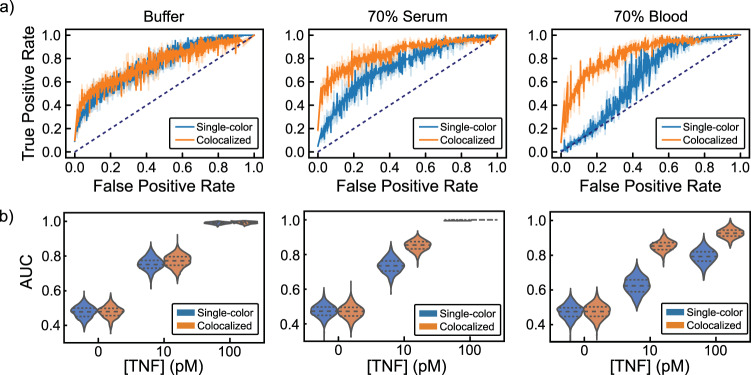
Fig. 4. Discriminating TNF-α concentrations using single-color and colocalized methods in buffer, 70% chicken serum, and 70% human blood.
a Bootstrapped ROC curves from binary classification between 10 pM TNF-α distributions and TNF-α-free negative controls in buffer (left), 70% chicken serum (middle), and 70% human blood (right). Dotted lines indicate random guess. Raw data in SI Fig. S9. b Area under the ROC curve values from binary classification for 0, 10, and 100 pM TNF-α with 1000 bootstrapped samples. Dashed lines demarcate quartiles of the distribution. All distributions are from 128 FOVs collected from two coverslips per condition.

