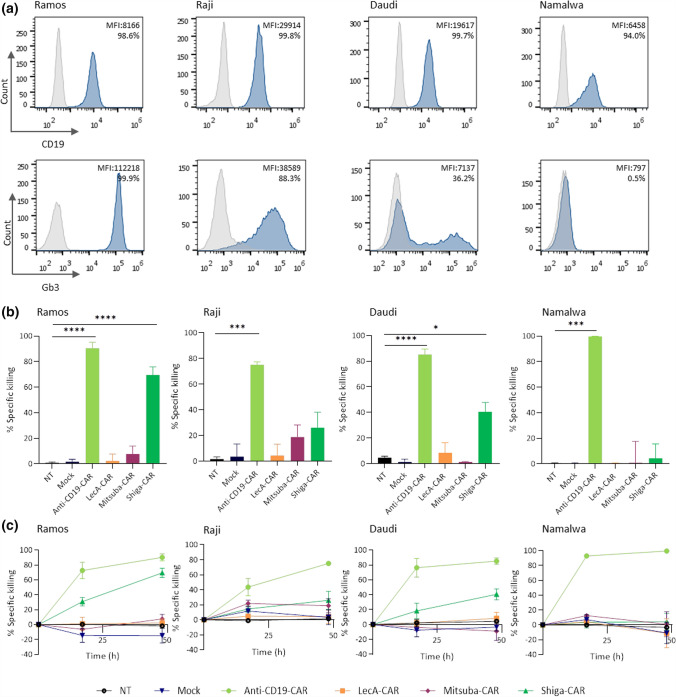
Fig. 2.
In vitro anti-tumour activity in Burkitt's lymphoma-derived cell lines induced by CAR T cells. a Expression of CD19 and Gb3 was assessed by staining with anti-CD19 antibody or labelled StxB and analysed by flow cytometry. Histogram for negative control (grey), CD19 and Gb3 stained samples (dark blue). The values provided in each histogram refer to the geometric mean fluorescence intensity (MFI) and the percentage of positively stained cells. Histograms are representative of at least three independent experiments. b Lectin-CARs-specific killing against Burkitt's lymphoma-derived cell lines was checked by luminescence assay. Data show the percent of specific killing after 48 h of co-incubation. c Kinetics of the anti-tumour activity of each lectin-CAR against Burkitt's lymphoma cell lines. One-way ANOVA was followed by Dunnett's multiple comparisons test. Mean values ± SEM are shown. *p < 0.05, **p < 0.01 ***p < 0.001, ****p < 0.0001. Data represent at least three independent donors

